Profiling Rust: The Complete Guide - From SQL Queries to CPU Sampling
Published: August 11, 2026
Reading time: 37 minutes
My goal with building hotpath-rs is to create an all-in-one Rust performance profiler - “that covers everyone’s use cases”. In this guide, I’ll walk through its current profiling capabilities with practical examples of finding and fixing real performance bottlenecks. We’ll look at different layers of a Rust application - from SQL queries, HTTP calls, and I/O to locks, memory allocations, and CPU usage - and discuss how to identify performance issues specific to each one. As hotpath-rs evolves with new features, I’ll keep this article updated to make it a comprehensive reference for profiling Rust.
Layers of performance optimization
Rust is rapidly evolving from its low-level systems programming roots into a general-purpose language. As a result, performance optimization is no longer just about CPU samples and flame graphs. An efficient Rust performance optimization workflow now requires insights into higher-level signals such as SQL queries, HTTP requests, async execution and I/O bottlenecks.
I’m ordering the sections of this guide by their potential return on investment. In many backend applications, optimizing SQL queries or parallelizing HTTP calls can yield better improvements than optimizing CPU usage. Low-level optimizations remain essential for CPU-bound or latency-critical code, but they’re often most effective after higher-level bottlenecks have been addressed.
To put this into perspective, optimizing a CPU hot path may save microseconds per operation, while eliminating an unnecessary database round trip or parallelizing independent HTTP calls can sometimes remove hundreds of milliseconds from a response time. That’s why this guide starts with higher layers of the stack and gradually works its way down to low-level optimizations.
Each layer comes with a practical code example: a sample performance bottleneck, the profiler report that exposes it, and a fix with a measurable impact confirmed by the before/after numbers.
Profiling SQL query performance
hotpath currently supports SQL tracing for sqlx, diesel, and toasty. See SQL tracing docs for details on how to enable it.
Let’s see it in action. We have a simple diesel schema: posts, each with multiple comments. We want to display a list of posts, each with the count of its comments. Here’s the naive implementation:
#[hotpath::measure]
fn list_comments(
    conn: &mut SqliteConnection,
) -> Result<Vec<(String, usize)>, Box<dyn std::error::Error>> {
    let all_posts: Vec<Post> = posts::table.load(conn)?;

    let mut result = Vec::with_capacity(all_posts.len());
    for post in all_posts {
        let post_comments: Vec<Comment> = comments::table
            .filter(comments::post_id.eq(post.id))
            .load(conn)?;
        result.push((post.title, post_comments.len()));
    }
    Ok(result)
}
The database is seeded with 20 posts, 5 comments each. Let’s profile it by running:
cargo run --release -p test-diesel --example n_plus_one_before --features hotpath
timing - Execution duration of functions.
+----------------------------------+-------+-----------+-----------+-----------+---------+
| Function                         | Calls | Avg       | P95       | Total     | % Total |
+----------------------------------+-------+-----------+-----------+-----------+---------+
| main                             | 1     | 1.56 ms   | 1.56 ms   | 1.56 ms   | 100.00% |
+----------------------------------+-------+-----------+-----------+-----------+---------+
| n_plus_one_before::list_comments | 1     | 104.29 µs | 104.32 µs | 104.29 µs | 6.67%   |
+----------------------------------+-------+-----------+-----------+-----------+---------+

sql - SQL query execution time statistics.
Total calls: 143
+--------------------------------------------------------------+----------------------------------+-------+-----------+-----------+-----------+---------+
| Query                                                        | Source                           | Calls | Avg       | P95       | Total     | % Total |
+--------------------------------------------------------------+----------------------------------+-------+-----------+-----------+-----------+---------+
| CREATE TABLE posts (id INTEGER PRIMARY KEY, title TEXT NO... | -                                | 1     | 510.25 µs | 510.46 µs | 510.25 µs | 61.55%  |
+--------------------------------------------------------------+----------------------------------+-------+-----------+-----------+-----------+---------+
| INSERT INTO `comments` (`id`, `post_id`, `body`) VALUES (... | -                                | 100   | 1.65 µs   | 1.71 µs   | 165.29 µs | 19.94%  |
+--------------------------------------------------------------+----------------------------------+-------+-----------+-----------+-----------+---------+
| SELECT `comments`.`id`, `comments`.`post_id`, `comments`.... | n_plus_one_before::list_comments | 20    | 3.42 µs   | 3.21 µs   | 68.45 µs  | 8.26%   |
+--------------------------------------------------------------+----------------------------------+-------+-----------+-----------+-----------+---------+
| INSERT INTO `posts` (`id`, `title`) VALUES (?, ?)            | -                                | 20    | 1.91 µs   | 1.62 µs   | 38.29 µs  | 4.62%   |
+--------------------------------------------------------------+----------------------------------+-------+-----------+-----------+-----------+---------+
| CREATE TABLE comments (id INTEGER PRIMARY KEY, post_id IN... | -                                | 1     | 31.29 µs  | 31.30 µs  | 31.29 µs  | 3.77%   |
+--------------------------------------------------------------+----------------------------------+-------+-----------+-----------+-----------+---------+
| SELECT `posts`.`id`, `posts`.`title` FROM `posts`            | n_plus_one_before::list_comments | 1     | 15.46 µs  | 15.46 µs  | 15.46 µs  | 1.86%   |
+--------------------------------------------------------------+----------------------------------+-------+-----------+-----------+-----------+---------+
hotpath normalizes queries, so instead of 20 separate log entries, the repeated per-post SELECT shows up as a single bucket with Calls: 20 - one query for each of the 20 posts. The Source column attributes it to list_comments, pointing straight at the function that needs fixing (queries issued outside of instrumented functions, like the seeding inserts, show - as their source). With profiling enabled we can instantly spot a repetitive N+1 query. While the overhead might seem negligible on a sample test database, in production apps N+1 queries can add seconds to response times.
How to fix N+1 SQL queries in Rust
The fix is to let the database do the counting - a single JOIN + GROUP BY query instead of one query per post:
#[hotpath::measure]
fn list_comments(
    conn: &mut SqliteConnection,
) -> Result<Vec<(String, i64)>, Box<dyn std::error::Error>> {
    let rows: Vec<(String, i64)> = posts::table
        .left_join(comments::table)
        .group_by((posts::id, posts::title))
        .select((posts::title, diesel::dsl::count(comments::id.nullable())))
        .order(posts::id.asc())
        .load(conn)?;
    Ok(rows)
}
cargo run --release -p test-diesel --example n_plus_one_after --features hotpath
timing - Execution duration of functions.
+---------------------------------+-------+----------+----------+----------+---------+
| Function                        | Calls | Avg      | P95      | Total    | % Total |
+---------------------------------+-------+----------+----------+----------+---------+
| main                            | 1     | 1.34 ms  | 1.34 ms  | 1.34 ms  | 100.00% |
+---------------------------------+-------+----------+----------+----------+---------+
| n_plus_one_after::list_comments | 1     | 70.08 µs | 70.14 µs | 70.08 µs | 5.23%   |
+---------------------------------+-------+----------+----------+----------+---------+

sql - SQL query execution time statistics.
Total calls: 123
+--------------------------------------------------------------+---------------------------------+-------+-----------+-----------+-----------+---------+
| Query                                                        | Source                          | Calls | Avg       | P95       | Total     | % Total |
+--------------------------------------------------------------+---------------------------------+-------+-----------+-----------+-----------+---------+
| CREATE TABLE posts (id INTEGER PRIMARY KEY, title TEXT NO... | -                               | 1     | 469.92 µs | 470.01 µs | 469.92 µs | 64.50%  |
+--------------------------------------------------------------+---------------------------------+-------+-----------+-----------+-----------+---------+
| INSERT INTO `comments` (`id`, `post_id`, `body`) VALUES (... | -                               | 100   | 1.41 µs   | 1.46 µs   | 140.72 µs | 19.32%  |
+--------------------------------------------------------------+---------------------------------+-------+-----------+-----------+-----------+---------+
| SELECT `posts`.`title`, count(`comments`.`id`) FROM (`pos... | n_plus_one_after::list_comments | 1     | 65.50 µs  | 65.50 µs  | 65.50 µs  | 8.99%   |
+--------------------------------------------------------------+---------------------------------+-------+-----------+-----------+-----------+---------+
| INSERT INTO `posts` (`id`, `title`) VALUES (?, ?)            | -                               | 20    | 1.64 µs   | 1.46 µs   | 32.87 µs  | 4.51%   |
+--------------------------------------------------------------+---------------------------------+-------+-----------+-----------+-----------+---------+
| CREATE TABLE comments (id INTEGER PRIMARY KEY, post_id IN... | -                               | 1     | 19.54 µs  | 19.55 µs  | 19.54 µs  | 2.68%   |
+--------------------------------------------------------------+---------------------------------+-------+-----------+-----------+-----------+---------+
The 21 queries attributed to list_comments collapsed into a single one, and the function’s execution time dropped from 104.29 µs to 70.08 µs - a ~1.5x improvement. Keep in mind that timing measurements are susceptible to run-to-run variations. That’s why capturing deterministic signals, like the number of executed queries, in addition to execution time makes the performance debugging workflow more effective. The query count is identical on every run, and watching it drop from 21 to 1 is proof that the fix worked, regardless of timing noise. And this is an in-memory SQLite database with 20 posts. In a production app, where each query pays a network round trip to the database server and tables hold thousands of rows, a similar fix can have a much larger impact.
In addition to N+1 detection, the % Total column makes it easy to quickly spot outliers - a single query dominating the database layer is often a sign of a missing index. If you’re on PostgreSQL, pg-extras-rs CLI can help you dig deeper into index usage and other database-level metrics.
On a side note, before migrating to Rust I did Ruby on Rails performance consulting for over 5 years. In my experience, N+1 SQL calls were by far the most common issue I discovered, and a simple fix often resulted in up to 10x response time improvement. If you’re planning a performance audit of a backend Rust app, I strongly suggest starting with hunting for N+1 SQL calls.
Profiling slow HTTP calls in Rust
Database queries are often the biggest bottleneck in backend applications, but HTTP requests usually come next. Modern Rust services rarely work in isolation - they call authentication providers, payment gateways, AI APIs, object storage, and dozens of other external systems.
Unlike CPU bottlenecks, HTTP latency is usually measured in milliseconds rather than microseconds. A single slow upstream service can dominate the response time of your entire application.
hotpath currently supports tracing for reqwest HTTP clients. Enabling it is a single line of config - wrapping the client in the hotpath::http! macro:
let client = hotpath::http!(reqwest::Client::new());From that point on, all HTTP calls issued by this client are tracked and automatically attributed to the instrumented functions they were called from.
Parallelizing sequential HTTP calls
One of the common performance issues is performing independent HTTP requests sequentially:
#[hotpath::measure]
async fn get_dashboard(client: &Client) -> Result<(), Box<dyn std::error::Error>> {
    let user = fetch(client, "https://jsonplaceholder.typicode.com/users/1").await?;
    let posts = fetch(client, "https://dummyjson.com/posts/1").await?;
    let comments = fetch(client, "https://postman-echo.com/get").await?;
    // ...
}
Since all three requests originate from a profiled get_dashboard(), hotpath automatically attributes them to that function. Let’s profile it by running:
cargo run --release -p test-reqwest-013 --example http_sequential --features hotpath
timing - Execution duration of functions.
+--------------------------------+-------+-----------+-----------+-----------+---------+
| Function                       | Calls | Avg       | P95       | Total     | % Total |
+--------------------------------+-------+-----------+-----------+-----------+---------+
| main                           | 1     | 874.68 ms | 875.04 ms | 874.68 ms | 100.00% |
+--------------------------------+-------+-----------+-----------+-----------+---------+
| http_sequential::get_dashboard | 1     | 873.30 ms | 873.46 ms | 873.30 ms | 99.84%  |
+--------------------------------+-------+-----------+-----------+-----------+---------+

http - HTTP request execution time statistics.
Total calls: 3
+---------------------------------------------+--------------------------------+-------+--------+-----------+-----------+-----------+---------+
| Endpoint                                    | Source                         | Calls | Errors | Avg       | P95       | Total     | % Total |
+---------------------------------------------+--------------------------------+-------+--------+-----------+-----------+-----------+---------+
| GET postman-echo.com/get                    | http_sequential::get_dashboard | 1     | 0      | 389.55 ms | 389.81 ms | 389.55 ms | 44.64%  |
+---------------------------------------------+--------------------------------+-------+--------+-----------+-----------+-----------+---------+
| GET jsonplaceholder.typicode.com/users/{id} | http_sequential::get_dashboard | 1     | 0      | 268.68 ms | 268.70 ms | 268.68 ms | 30.79%  |
+---------------------------------------------+--------------------------------+-------+--------+-----------+-----------+-----------+---------+
| GET dummyjson.com/posts/{id}                | http_sequential::get_dashboard | 1     | 0      | 214.34 ms | 214.43 ms | 214.34 ms | 24.56%  |
+---------------------------------------------+--------------------------------+-------+--------+-----------+-----------+-----------+---------+
The report makes the antipattern easy to spot: get_dashboard takes 873.30 ms, almost exactly the sum of the three request latencies (389.55 ms + 268.68 ms + 214.34 ms). Each request contributes its full latency to the total because they are awaited one after another.
Since the requests are independent, the fix is to run them concurrently with tokio::try_join!:
#[hotpath::measure]
async fn get_dashboard(client: &Client) -> Result<(), Box<dyn std::error::Error>> {
    let (user, posts, comments) = tokio::try_join!(
        fetch(client, "https://jsonplaceholder.typicode.com/users/1"),
        fetch(client, "https://dummyjson.com/posts/1"),
        fetch(client, "https://postman-echo.com/get"),
    )?;
    // ...
}
cargo run --release -p test-reqwest-013 --example http_parallel --features hotpath
timing - Execution duration of functions.
+------------------------------+-------+-----------+-----------+-----------+---------+
| Function                     | Calls | Avg       | P95       | Total     | % Total |
+------------------------------+-------+-----------+-----------+-----------+---------+
| main                         | 1     | 395.96 ms | 396.10 ms | 395.96 ms | 100.00% |
+------------------------------+-------+-----------+-----------+-----------+---------+
| http_parallel::get_dashboard | 1     | 394.93 ms | 395.05 ms | 394.93 ms | 99.74%  |
+------------------------------+-------+-----------+-----------+-----------+---------+

http - HTTP request execution time statistics.
Total calls: 3
+---------------------------------------------+------------------------------+-------+--------+-----------+-----------+-----------+---------+
| Endpoint                                    | Source                       | Calls | Errors | Avg       | P95       | Total     | % Total |
+---------------------------------------------+------------------------------+-------+--------+-----------+-----------+-----------+---------+
| GET postman-echo.com/get                    | http_parallel::get_dashboard | 1     | 0      | 393.94 ms | 394.00 ms | 393.94 ms | 42.44%  |
+---------------------------------------------+------------------------------+-------+--------+-----------+-----------+-----------+---------+
| GET dummyjson.com/posts/{id}                | http_parallel::get_dashboard | 1     | 0      | 300.57 ms | 300.68 ms | 300.57 ms | 32.38%  |
+---------------------------------------------+------------------------------+-------+--------+-----------+-----------+-----------+---------+
| GET jsonplaceholder.typicode.com/users/{id} | http_parallel::get_dashboard | 1     | 0      | 233.77 ms | 233.83 ms | 233.77 ms | 25.18%  |
+---------------------------------------------+------------------------------+-------+--------+-----------+-----------+-----------+---------+
The individual requests aren’t made faster by this change, but get_dashboard now takes 394.93 ms - roughly the duration of the slowest request instead of their combined duration. The requests are still attributed to get_dashboard, because they are polled inside its measured scope. A one-line change resulted in a ~2x speedup, and the gain grows with the number of parallelized calls.
See the HTTP tracing documentation for setup instructions and configuration options. If the slow calls happen inside a web server, hotpath can also profile axum routes and attribute each SQL query and outbound HTTP request to the endpoint that triggered it.
Profiling I/O reads and writes
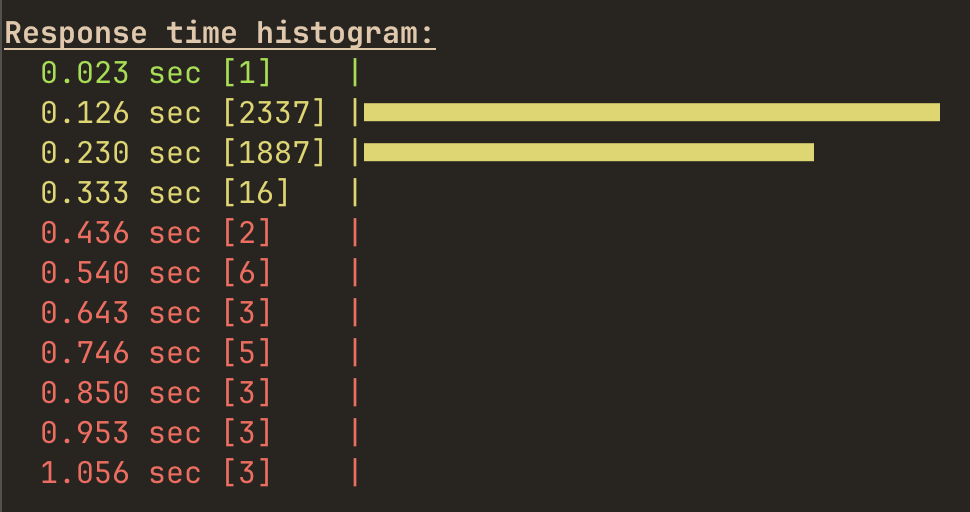
I regularly test hotpath against real-world codebases, with maplibre/martin being one of them. Adding I/O instrumentation to their encoders instantly highlighted a Brotli misconfiguration, and the fix resulted in ~30x response time improvement.
Brotli encoding speed before:

Response time for 'Accept-Encoding: br' before:
Brotli encoding speed after:

Response time after:
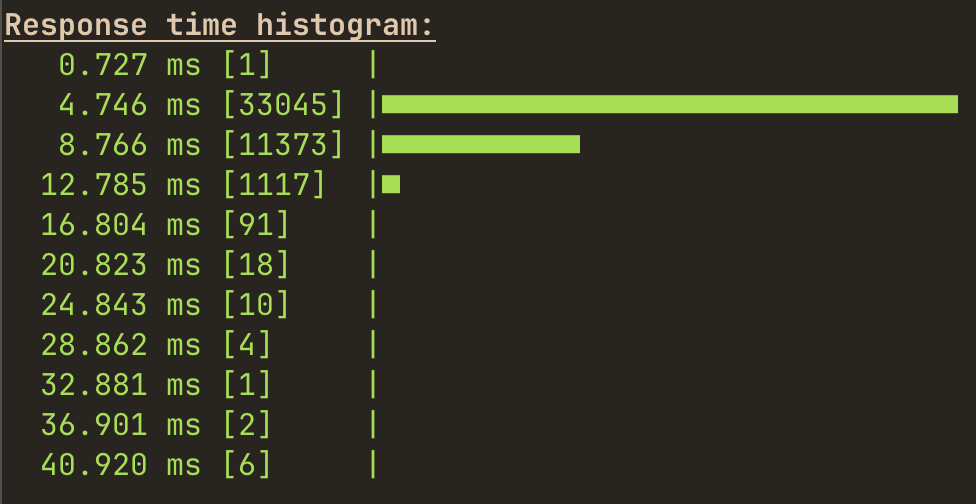
A single config tweak improved Brotli encoding speed from 27.9 KB/s to 1.6 MB/s (~57x), cutting response times from the 126-230 ms range to under 9 ms.
hotpath-rs provides instrumentation wrappers for the std Read/Write and tokio’s AsyncRead/AsyncWrite traits.
These are lower-level I/O primitives than the previously discussed HTTP and SQL clients, and allow monitoring an application’s byte flow in more detail. Since we instrument traits, not a concrete type, you can enable profiling for any compatible I/O type: TCP connections, file read/write operations, Redis communication, compressors, etc.
Instrumenting your application’s I/O makes throughput outliers immediately visible. In the Martin example, the Brotli encoder processed data at just 27.9 KB/s, compared with 17.7 MB/s for gzip.
Using the hotpath::io! macro you can quickly compare the compression ratio and throughput of different encoder configurations:
examples/compression_levels_io.rs
let mut encoder = hotpath::io!(
    brotli::CompressorWriter::new(
        hotpath::io!(
            Vec::new(),
            label = format!("brotli-{level}-out"),
            iter = true
        ),
        4096,
        level,
        22,
    ),
    label = format!("brotli-{level}"),
    iter = true
);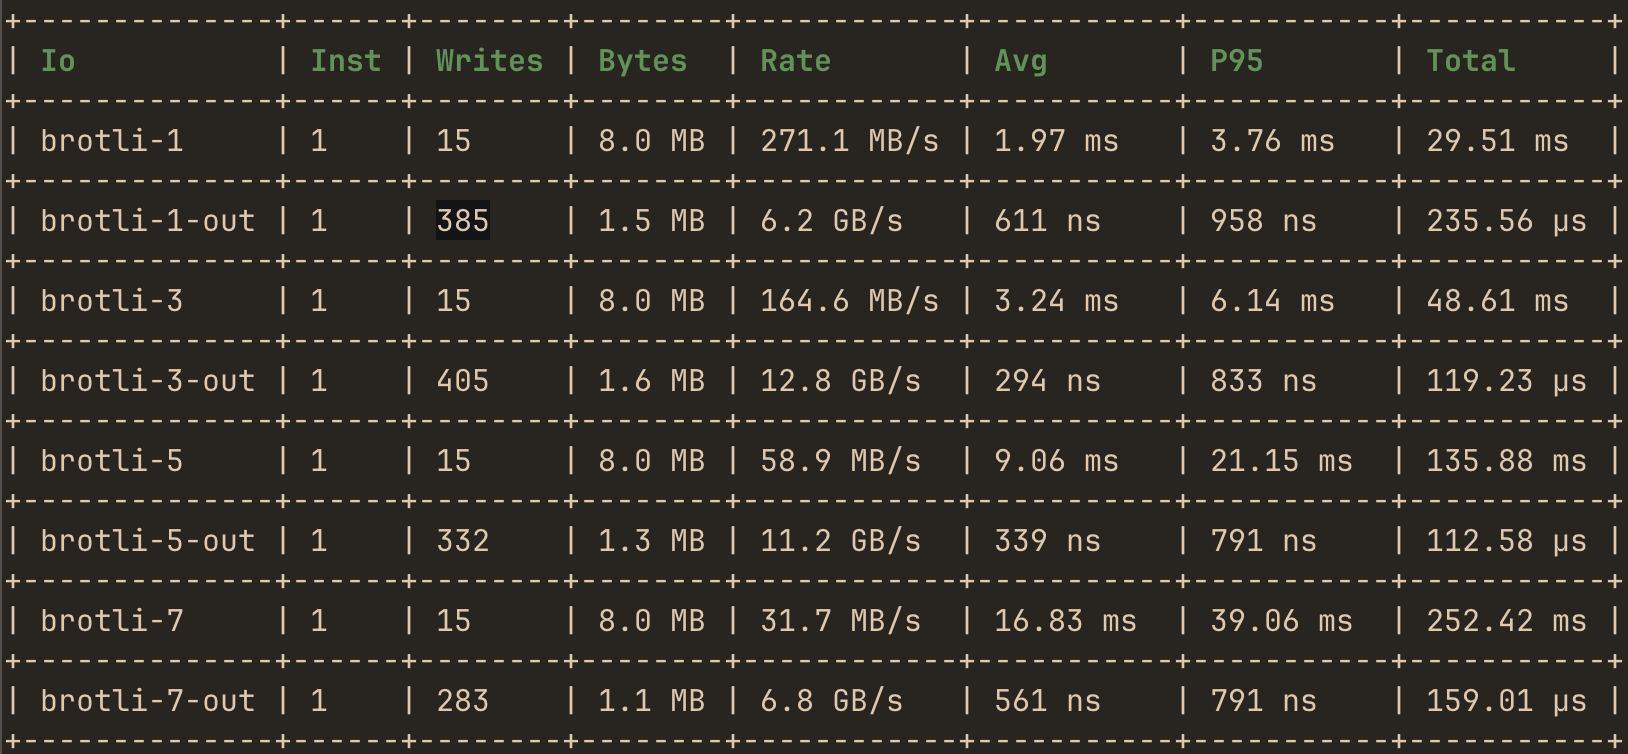
In the above example we use the hotpath::io! macro to instrument both the Brotli encoder and its output buffer. Vec<u8> automatically implements Write so it can be treated as a write I/O data source. By comparing Bytes between brotli-1 and brotli-1-out we can calculate the compression ratio, and Rate provides info on how fast data is processed.
You can clearly see that with increasing compression levels, the encoding rate decreases but the compression ratio increases.
Instrumenting different Rust I/O types
Another interesting use case is instrumenting different I/O interface types, to check what byte throughput is realistic:
cargo run --release -p test-io --example multi_io --features hotpath
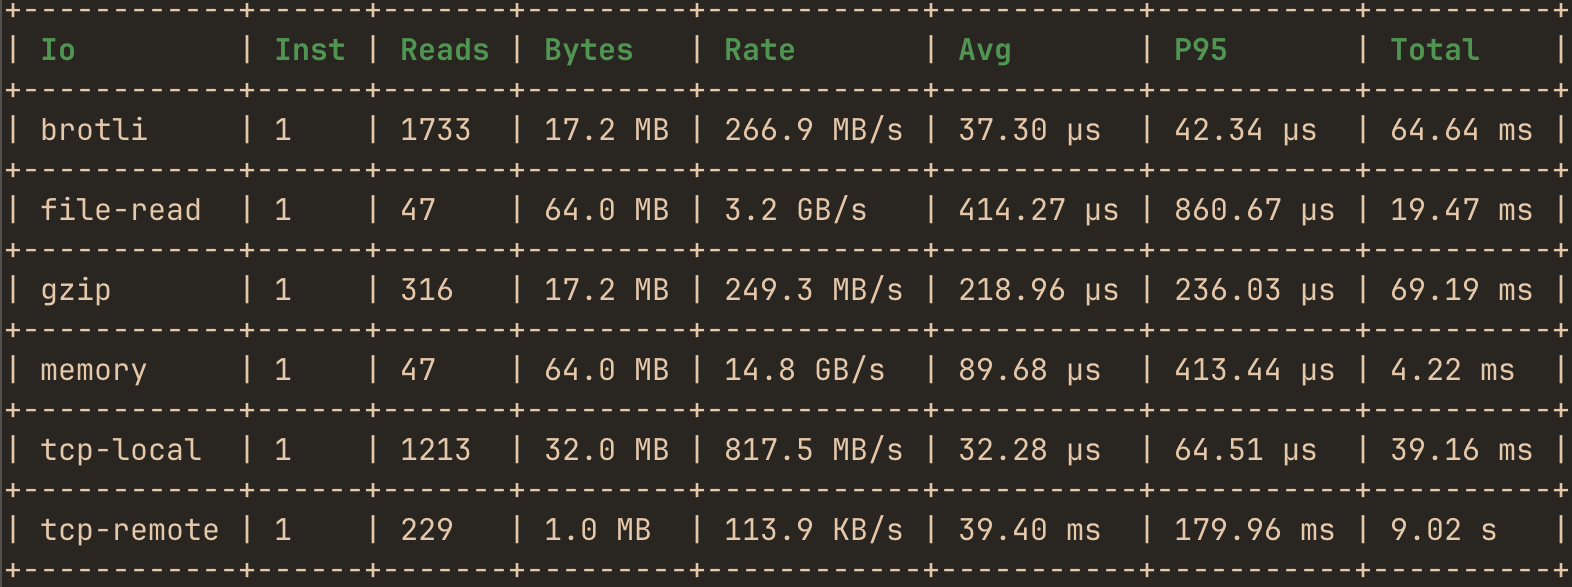
The observed rates span five orders of magnitude. In-memory reads are the fastest at 14.8 GB/s, with buffered file reads following at 3.2 GB/s. Local TCP reaches 817.5 MB/s, while decompression throughput lands at around 250 MB/s for both gzip and Brotli. The remote TCP connection is the clear outlier at 113.9 KB/s.
hotpath::io! is a recent addition to the hotpath profiling toolkit. I hope this new profiling mode will provide useful insights for your Rust project. See the I/O tracing documentation for supported wrapper types and configuration options.
Profiling Mutex and RwLock contention
Lock contention is one of the harder performance problems to spot. A Mutex or RwLock guard held for too long doesn’t produce any error or log entry - other threads just silently queue up, and the latency shows up in a completely different part of the codebase than the one causing it.
hotpath instruments locks via the rw_lock! and mutex! macros. For every acquisition it tracks two durations:
- Wait time - how long a caller was blocked before the lock was granted. High wait time means contention: threads are queuing for the lock.
- Acquire time - how long the lock was held, from granted to released. Long hold times are what create the contention other threads wait on.
You just need to wrap a lock at creation:
let cache = Arc::new(hotpath::rw_lock!(
    tokio::sync::RwLock::new(Vec::new()),
    label = "quotes_cache"
));
Let’s see it in action. Two tokio tasks share a cache behind a tokio::sync::RwLock: a writer task periodically refreshes it with data from a slow HTTP API, and a reader task frequently checks the latest value. Here’s the problematic writer implementation:
examples/lock_contention_before.rs
#[hotpath::measure]
async fn refresh_quotes(
    client: &reqwest::Client,
    cache: &Cache,
) -> Result<(), Box<dyn std::error::Error + Send + Sync>> {
    // Antipattern: the write guard is held across the whole HTTP round trip,
    // so every reader is blocked until the response arrives.
    let mut quotes = cache.write().await;
    let body = client.get(URL).send().await?.text().await?;
    quotes.push(body);
    Ok(())
}

#[hotpath::measure]
async fn latest_quote(cache: &Cache) -> Option<usize> {
    let quotes = cache.read().await;
    quotes.last().map(|q| q.len())
}
The write guard is acquired before the HTTP call, so it is held for the entire network round trip (the example uses an endpoint that responds after a 1-second delay, to simulate a slow upstream API). Let’s profile it:
cargo run --release -p test-rw-lock-tokio --example lock_contention_before --features hotpath
timing - Execution duration of functions.
+----------------------------------------+-------+----------+--------+--------+---------+
| Function                               | Calls | Avg      | P95    | Total  | % Total |
+----------------------------------------+-------+----------+--------+--------+---------+
| main                                   | 1     | 6.12 s   | 6.12 s | 6.12 s | 100.00% |
+----------------------------------------+-------+----------+--------+--------+---------+
| lock_contention_before::refresh_quotes | 3     | 1.23 s   | 1.36 s | 3.68 s | 60.19%  |
+----------------------------------------+-------+----------+--------+--------+---------+
| lock_contention_before::latest_quote   | 50    | 69.76 ms | 1.11 s | 3.49 s | 57.02%  |
+----------------------------------------+-------+----------+--------+--------+---------+

rw_locks - RwLock wait & acquire time statistics.
+--------------+-------+----------+----------+----------+---------+
| RwLock       | Reads | Wait avg | Wait P95 | Acq avg  | Acq P95 |
+--------------+-------+----------+----------+----------+---------+
| quotes_cache | 51    | 68.39 ms | 1.11 s   | 10.43 µs | 2.04 µs |
+--------------+-------+----------+----------+----------+---------+

+--------------+--------+----------+----------+---------+---------+
| RwLock       | Writes | Wait avg | Wait P95 | Acq avg | Acq P95 |
+--------------+--------+----------+----------+---------+---------+
| quotes_cache | 3      | 346 ns   | 541 ns   | 1.23 s  | 1.36 s  |
+--------------+--------+----------+----------+---------+---------+
The report tells the whole story. The write acquire time averages 1.23 s - the guard is held for the full duration of the HTTP request. And the readers pay for it: latest_quote, a function that does nothing but read the last element of a Vec, has a P95 of 1.11 s. The read acquire time stays in microseconds - readers hold the lock only briefly - but their wait time explodes, because they’re stuck behind a writer that’s waiting on the network.
How to fix a long-held lock guard
The fix: perform the slow operation first, and acquire the lock only when the data is ready:
examples/lock_contention_after.rs
#[hotpath::measure]
async fn refresh_quotes(
    client: &reqwest::Client,
    cache: &Cache,
) -> Result<(), Box<dyn std::error::Error + Send + Sync>> {
    // Fix: download the data first, acquire the write guard only when the
    // response is ready.
    let body = client.get(URL).send().await?.text().await?;
    let mut quotes = cache.write().await;
    quotes.push(body);
    Ok(())
}
cargo run --release -p test-rw-lock-tokio --example lock_contention_after --features hotpath
timing - Execution duration of functions.
+---------------------------------------+-------+---------+---------+-----------+---------+
| Function                              | Calls | Avg     | P95     | Total     | % Total |
+---------------------------------------+-------+---------+---------+-----------+---------+
| main                                  | 1     | 3.98 s  | 3.98 s  | 3.98 s    | 100.00% |
+---------------------------------------+-------+---------+---------+-----------+---------+
| lock_contention_after::refresh_quotes | 3     | 1.27 s  | 1.50 s  | 3.82 s    | 96.03%  |
+---------------------------------------+-------+---------+---------+-----------+---------+
| lock_contention_after::latest_quote   | 50    | 4.58 µs | 9.42 µs | 228.86 µs | 0.01%   |
+---------------------------------------+-------+---------+---------+-----------+---------+

rw_locks - RwLock wait & acquire time statistics.
+--------------+-------+----------+----------+---------+---------+
| RwLock       | Reads | Wait avg | Wait P95 | Acq avg | Acq P95 |
+--------------+-------+----------+----------+---------+---------+
| quotes_cache | 51    | 1.65 µs  | 2.67 µs  | 9.61 µs | 1.96 µs |
+--------------+-------+----------+----------+---------+---------+

+--------------+--------+----------+----------+---------+---------+
| RwLock       | Writes | Wait avg | Wait P95 | Acq avg | Acq P95 |
+--------------+--------+----------+----------+---------+---------+
| quotes_cache | 3      | 1.69 µs  | 1.92 µs  | 1.74 µs | 2.21 µs |
+--------------+--------+----------+----------+---------+---------+
refresh_quotes still takes over a second per call - the HTTP request is as slow as before - but now nobody else cares. The write acquire time dropped from 1.23 s to 1.74 µs, the read wait time from 68.39 ms avg (P95 1.11 s) to single-digit microseconds, and latest_quote P95 went from 1.11 s to 9.42 µs - a >100,000x reduction in P95 latency for the reader path.
This example is deliberately exaggerated - an HTTP call inside a write guard against a 1-second endpoint makes the numbers impossible to miss. But the same pattern hides in real codebases in subtler forms: an .await point inside a guard, a disk read, an expensive serialization, a nested lock. Long-held guards can wreck the latency of other tasks or threads contending for the same lock, and the victims are usually far away from the culprit. The Wait avg/Acq avg split makes it easy to diagnose lock contention. High acquire time shows which lock holder is causing contention, while high wait time shows which callers are affected by it.
Everything above applies to Mutex as well - wrap it with the mutex! macro and you get the same wait/acquire stats (a mutex has a single lock kind, so there’s no read/write split). Both macros support std, parking_lot, tokio, and async-lock primitives, and are no-ops unless the hotpath feature is enabled. See the locks documentation for details.
Channel throughput and queue depth
Channels are the basic building block of most concurrent Rust architectures - worker pools, actor systems, background job queues. And similarly to locks, their performance issues can easily go unnoticed. A consumer that can’t keep up with its producer doesn’t return an error - messages just quietly accumulate in the channel’s internal buffer. With an unbounded channel there is no backpressure at all: the queue keeps growing until the process runs out of memory and crashes with an OOM error. A bounded channel prevents the queue itself from growing without limit - once the buffer is full, sends block (or fail, for try_send) until the consumer catches up - but the problem doesn’t disappear: instead of growing memory, backpressure propagates upstream and shows up as producers stalling and rising end-to-end latency.
For a lower-level look at the wrapper APIs and the profiler’s own queue metrics, see the deep dive into async Rust channel instrumentation.
The channel! macro wraps a channel at creation and tracks its throughput, queue depth, and send→receive latency:
let (tx, mut rx) = hotpath::channel!(
    tokio::sync::mpsc::unbounded_channel::<u64>(),
    label = "jobs"
);
Let’s look at a minimal producer/consumer pipeline. The producer sends a job every 5 ms, and the consumer needs 25 ms to process one - we mock the slow consumer with a sleep, standing in for a database insert or an API call that takes longer than the interval between incoming jobs:
examples/channels_queue_before.rs
#[hotpath::measure]
async fn process_job(_job: u64) {
    tokio::time::sleep(Duration::from_millis(25)).await;
}

let producer = tokio::spawn(async move {
    for job in 0..100 {
        tx.send(job).unwrap();
        tokio::time::sleep(Duration::from_millis(5)).await;
    }
});

let consumer = tokio::spawn(async move {
    while let Some(job) = rx.recv().await {
        process_job(job).await;
    }
});
cargo run --release -p test-channels-tokio --example channels_queue_before --features hotpath
timing - Execution duration of functions.
+------------------------------------+-------+----------+----------+--------+---------+
| Function                           | Calls | Avg      | P95      | Total  | % Total |
+------------------------------------+-------+----------+----------+--------+---------+
| main                               | 1     | 2.83 s   | 2.83 s   | 2.83 s | 100.00% |
+------------------------------------+-------+----------+----------+--------+---------+
| channels_queue_before::process_job | 100   | 28.25 ms | 31.15 ms | 2.83 s | 99.96%  |
+------------------------------------+-------+----------+----------+--------+---------+

channels - Channel throughput statistics.
+---------+-----------+------+------+----------+--------+--------+-----------+
| Channel | Type      | Inst | Sent | Received | Sent/s | Recv/s | Max queue |
+---------+-----------+------+------+----------+--------+--------+-----------+
| jobs    | unbounded | 1    | 100  | 100      | 35.4   | 35.4   | 73        |
+---------+-----------+------+------+----------+--------+--------+-----------+

channels latency - Channel send->receive latency statistics.
+---------+------+--------+--------+
| Channel | Msgs | Avg    | P95    |
+---------+------+--------+--------+
| jobs    | 100  | 1.03 s | 1.98 s |
+---------+------+--------+--------+
Max queue is the metric to watch: out of 100 messages sent, up to 73 were sitting in the buffer at once - the producer finished its work while the consumer had barely started. The latency table shows the consequence: a message spent on average 1.03 s (P95 1.98 s) in the queue before the consumer even picked it up. In this example the producer stops after 100 jobs, so the queue eventually drains. In a long-running service with a continuous producer, that queue never stops growing - each buffered message holds memory, and an unbounded channel will happily keep accepting them until the process is killed by the OOM killer.
The fix is to make the consumer keep up with the producer - speed up the processing (or shard it across multiple consumer tasks). In the fixed example only the consumer changes: processing now takes 2 ms, while jobs still arrive every 5 ms:
examples/channels_queue_after.rs
cargo run --release -p test-channels-tokio --example channels_queue_after --features hotpath
timing - Execution duration of functions.
+-----------------------------------+-------+-----------+-----------+-----------+---------+
| Function                          | Calls | Avg       | P95       | Total     | % Total |
+-----------------------------------+-------+-----------+-----------+-----------+---------+
| main                              | 1     | 652.68 ms | 652.74 ms | 652.68 ms | 100.00% |
+-----------------------------------+-------+-----------+-----------+-----------+---------+
| channels_queue_after::process_job | 100   | 3.63 ms   | 3.78 ms   | 363.43 ms | 55.68%  |
+-----------------------------------+-------+-----------+-----------+-----------+---------+

channels - Channel throughput statistics.
+---------+-----------+------+------+----------+--------+--------+-----------+
| Channel | Type      | Inst | Sent | Received | Sent/s | Recv/s | Max queue |
+---------+-----------+------+------+----------+--------+--------+-----------+
| jobs    | unbounded | 1    | 100  | 100      | 152.7  | 152.7  | 1         |
+---------+-----------+------+------+----------+--------+--------+-----------+

channels latency - Channel send->receive latency statistics.
+---------+------+---------+---------+
| Channel | Msgs | Avg     | P95     |
+---------+------+---------+---------+
| jobs    | 100  | 2.33 µs | 3.58 µs |
+---------+------+---------+---------+
Max queue dropped from 73 to 1 - every message is picked up before the next one arrives - and the send→receive latency went from over a second to microseconds. The timing table confirms the fix on the processing side too: process_job went from 28.25 ms to 3.63 ms avg per message, so the total time from sending a message to having it processed dropped from over a second - almost all of it spent waiting in the queue - to under 4 ms. A healthy pipeline keeps Max queue low and roughly constant; a Max queue that keeps climbing between report runs is an early warning of the OOM scenario above, visible long before memory usage becomes a problem.
The mocked sleeps make the imbalance obvious, but the mechanics are identical in production pipelines: any consumer that is consistently slower than its producer - even by a millisecond per message - means an unbounded queue that grows without limit. channel! supports std, tokio, crossbeam, flume, futures, and other channel flavors, both bounded and unbounded. See the data flow documentation for the full list and configuration options.
Memory allocations
hotpath-alloc mode enables memory allocation tracing. It shows the allocated bytes or number of allocations for each instrumented function, along with global per-thread statistics.
Allocation metrics are particularly useful for deterministic benchmarks because they are often perfectly reproducible, down to a single byte.
An example source of excessive allocations is cloning a String for every message that crosses a thread boundary. Let’s look at a minimal two-thread pipeline: a producer thread sends a 1 KB payload through a bounded channel 5 million times, and a consumer thread processes each message. Naming the threads via std::thread::Builder makes the per-thread report easy to read:
examples/string_clones_before.rs
const MESSAGES: usize = 5_000_000;

// Every message is an owned copy: one heap allocation + memcpy per send.
#[hotpath::measure]
fn send(payload: &str, tx: &mpsc::SyncSender<String>) {
    tx.send(payload.to_owned()).unwrap();
}

#[hotpath::measure]
fn process(message: String) -> usize {
    std::hint::black_box(message.len())
}

#[hotpath::main(report = "functions-timing,functions-alloc,threads", threads_limit = 2)]
fn main() {
    let (tx, rx) = mpsc::sync_channel::<String>(1024);

    let producer = std::thread::Builder::new()
        .name("producer".into())
        .spawn(move || {
            let payload: String = "x".repeat(1024);
            for _ in 0..MESSAGES {
                send(&payload, &tx);
            }
        })
        .unwrap();

    let consumer = std::thread::Builder::new()
        .name("consumer".into())
        .spawn(move || {
            while let Ok(message) = rx.recv() {
                process(message);
            }
        })
        .unwrap();

    producer.join().unwrap();
    consumer.join().unwrap();
}
The threads report section is enabled alongside the alloc one - with hotpath-alloc active it shows how many bytes each thread allocated and deallocated, sorted by the heaviest memory traffic (threads_limit = 2 keeps only the two heaviest rows in the table). Let’s profile it by running:
cargo run --release -p test-alloc --example string_clones_before --features hotpath,hotpath-alloc
timing - Function execution time metrics.
+-------------------------------+---------+-----------+-----------+-----------+---------+
| Function                      | Calls   | Avg       | P95       | Total     | % Total |
+-------------------------------+---------+-----------+-----------+-----------+---------+
| string_clones_before::main    | 1       | 669.72 ms | 670.04 ms | 669.72 ms | 100.00% |
+-------------------------------+---------+-----------+-----------+-----------+---------+
| string_clones_before::send    | 5000000 | 98 ns     | 166 ns    | 490.63 ms | 73.26%  |
+-------------------------------+---------+-----------+-----------+-----------+---------+
| string_clones_before::process | 5000000 | 6 ns      | 41 ns     | 33.30 ms  | 4.97%   |
+-------------------------------+---------+-----------+-----------+-----------+---------+

alloc-bytes - Exclusive allocation bytes by each function (excluding nested calls).
Total: 4.8 GB
+-------------------------------+---------+---------+---------+---------+---------+
| Function                      | Calls   | Avg     | P95     | Total   | % Total |
+-------------------------------+---------+---------+---------+---------+---------+
| string_clones_before::send    | 5000000 | 1.0 KB  | 1.0 KB  | 4.8 GB  | 100.00% |
+-------------------------------+---------+---------+---------+---------+---------+
| string_clones_before::main    | 1       | 32.9 KB | 32.9 KB | 32.9 KB | 0.00%   |
+-------------------------------+---------+---------+---------+---------+---------+
| string_clones_before::process | 5000000 | 0 B     | 0 B     | 0 B     | 0.00%   |
+-------------------------------+---------+---------+---------+---------+---------+

threads - Thread CPU and memory statistics. (RSS: 1.4 GB, Alloc: 4.8 GB, Dealloc: 4.8 GB, Diff: 1.6 KB, 2/12)
+----------+--------+------+------+------+--------+---------+---------+
| Thread   | Status | CPU% | Max% | Avg% | Alloc  | Dealloc | Diff    |
+----------+--------+------+------+------+--------+---------+---------+
| consumer | Exited | -    | -    | -    | 1.3 KB | 4.8 GB  | -4.8 GB |
+----------+--------+------+------+------+--------+---------+---------+
| producer | Exited | -    | -    | -    | 4.8 GB | 1.1 KB  | 4.8 GB  |
+----------+--------+------+------+------+--------+---------+---------+
The alloc-bytes table makes the cost visible: every send call allocates 1.0 KB - a fresh copy of the payload - adding up to 4.8 GB pushed through the allocator over the program’s lifetime. The threads section tells the same story from the memory-ownership angle: the producer thread allocated 4.8 GB, and the consumer thread deallocated 4.8 GB - each message was allocated on one thread and freed on another, a pattern typical for channel pipelines. Threads that already finished, like both workers here, are reported with the Exited status and their final allocation stats. And just like the query count from the SQL section, allocated bytes are a deterministic signal: the same code path allocates the same number of bytes on every run, making it a reliable metric for catching regressions.
How to avoid String clone allocations with Arc<str>
The payload is never mutated after creation, so the consumer doesn’t need its own copy - both threads can share one buffer. That’s exactly what Arc<str> provides: the string data is allocated once, and every clone is just an atomic reference count bump:
examples/string_clones_after.rs
// All messages share one heap buffer: a clone only bumps the refcount.
#[hotpath::measure]
fn send(payload: &Arc<str>, tx: &mpsc::SyncSender<Arc<str>>) {
    tx.send(Arc::clone(payload)).unwrap();
}

#[hotpath::measure]
fn process(message: Arc<str>) -> usize {
    std::hint::black_box(message.len())
}

// The payload data is allocated once, at creation:
let payload: Arc<str> = Arc::from("x".repeat(1024));
The rest of the example is identical - only the message type changed from String to Arc<str>:
cargo run --release -p test-alloc --example string_clones_after --features hotpath,hotpath-alloc
timing - Function execution time metrics.
+------------------------------+---------+-----------+-----------+-----------+---------+
| Function                     | Calls   | Avg       | P95       | Total     | % Total |
+------------------------------+---------+-----------+-----------+-----------+---------+
| string_clones_after::main    | 1       | 517.35 ms | 517.47 ms | 517.35 ms | 100.00% |
+------------------------------+---------+-----------+-----------+-----------+---------+
| string_clones_after::send    | 5000000 | 68 ns     | 208 ns    | 341.50 ms | 66.01%  |
+------------------------------+---------+-----------+-----------+-----------+---------+
| string_clones_after::process | 5000000 | 6 ns      | 41 ns     | 31.28 ms  | 6.05%   |
+------------------------------+---------+-----------+-----------+-----------+---------+

alloc-bytes - Exclusive allocation bytes by each function (excluding nested calls).
Total: 25.1 KB
+------------------------------+---------+---------+---------+---------+---------+
| Function                     | Calls   | Avg     | P95     | Total   | % Total |
+------------------------------+---------+---------+---------+---------+---------+
| string_clones_after::main    | 1       | 24.9 KB | 24.9 KB | 24.9 KB | 99.19%  |
+------------------------------+---------+---------+---------+---------+---------+
| string_clones_after::send    | 5000000 | 0 B     | 0 B     | 0 B     | 0.00%   |
+------------------------------+---------+---------+---------+---------+---------+
| string_clones_after::process | 5000000 | 0 B     | 0 B     | 0 B     | 0.00%   |
+------------------------------+---------+---------+---------+---------+---------+

threads - Thread CPU and memory statistics. (RSS: 1.5 GB, Alloc: 30.4 KB, Dealloc: 28.9 KB, Diff: 1.6 KB, 2/12)
+----------+----------+------+------+------+---------+---------+----------+
| Thread   | Status   | CPU% | Max% | Avg% | Alloc   | Dealloc | Diff     |
+----------+----------+------+------+------+---------+---------+----------+
| consumer | Exited   | -    | -    | -    | 1.3 KB  | 27.2 KB | -26.0 KB |
+----------+----------+------+------+------+---------+---------+----------+
| main     | Sleeping | 0.0% | 0.1% | 0.0% | 24.9 KB | 154 B   | 24.8 KB  |
+----------+----------+------+------+------+---------+---------+----------+
send now allocates 0 B per call - the 4.8 GB of allocation traffic collapsed to 25.1 KB for the whole program, and the per-thread traffic of both workers dropped from gigabytes to kilobytes (the producer fell out of the top-2 rows entirely, replaced by main). The timing table also shows the execution cost of creating these owned copies: the average send duration dropped from 98 ns to 68 ns, and the total runtime from 670 ms to 517 ms - a ~1.3x speedup from a change that didn’t touch the logic at all.
The trade-off is that Arc<str> is immutable - if a consumer needs to modify its copy, it has to convert it into an owned String first (paying the allocation it avoided). But for the common case of read-only shared data - config values, event payloads, cache keys, etc. - Arc<str> can eliminate unnecessary copies.
Allocation tracking also works with custom global allocators like jemallocator - hotpath wraps the allocator of your choice instead of the default system one. See the memory profiling docs for the setup and more configuration options.
CPU sampling
With the higher layers covered, we finally get to the classic profiling territory: finding out which functions burn the CPU. With the hotpath-cpu feature enabled, hotpath records a sampling profile of your program using samply and attributes the collected samples to instrumented functions. It requires a one-time setup of the samply binary and profiling permissions - see the CPU profiling docs for the details.
Let’s see it in action on a small log-processing pipeline: 10,000 log lines are validated against a regex, and log-level counts are aggregated over them. The naive implementation hides a classic mistake:
examples/regex_compile_before.rs
#[hotpath::measure]
fn compile_pattern() -> Regex {
    Regex::new(r"^\d{4}-\d{2}-\d{2} (ERROR|WARN|INFO) .+").unwrap()
}

// A fresh Regex is compiled for every line: parsing the pattern costs far
// more CPU than matching it.
#[hotpath::measure]
fn is_valid(line: &str) -> bool {
    compile_pattern().is_match(line)
}

#[hotpath::measure]
fn parse_logs(lines: &[String]) -> usize {
    lines.iter().filter(|line| is_valid(line)).count()
}

// The other pipeline stage: aggregate log level counts over the parsed lines.
#[hotpath::measure]
fn count_levels(lines: &[String]) -> [usize; 3] {
    let mut counts = [0usize; 3];
    for line in lines {
        for (i, level) in ["ERROR", "WARN", "INFO"].iter().enumerate() {
            if line.contains(level) {
                counts[i] += 1;
            }
        }
    }
    counts
}
Let’s profile it by running:
cargo run --release -p test-cpu --example regex_compile_before --features hotpath,hotpath-cpu
timing - Execution duration of functions.
+---------------------------------------+-------+-----------+-----------+----------+---------+
| Function                              | Calls | Avg       | P95       | Total    | % Total |
+---------------------------------------+-------+-----------+-----------+----------+---------+
| regex_compile_before::main            | 1     | 2.15 s    | 2.15 s    | 2.15 s   | 100.00% |
+---------------------------------------+-------+-----------+-----------+----------+---------+
| regex_compile_before::parse_logs      | 1     | 1.67 s    | 1.67 s    | 1.67 s   | 77.46%  |
+---------------------------------------+-------+-----------+-----------+----------+---------+
| regex_compile_before::is_valid        | 10000 | 163.17 µs | 193.66 µs | 1.63 s   | 75.80%  |
+---------------------------------------+-------+-----------+-----------+----------+---------+
| regex_compile_before::compile_pattern | 10000 | 157.15 µs | 186.88 µs | 1.57 s   | 73.00%  |
+---------------------------------------+-------+-----------+-----------+----------+---------+
| regex_compile_before::count_levels    | 300   | 139.19 µs | 159.49 µs | 41.76 ms | 1.94%   |
+---------------------------------------+-------+-----------+-----------+----------+---------+

cpu - CPU sampling attribution per function (exclusive). (1812108 total samples)
+---------------------------------------+---------+---------+
| Function                              | Samples | % Total |
+---------------------------------------+---------+---------+
| regex_compile_before::compile_pattern | 1679612 | 92.69%  |
+---------------------------------------+---------+---------+
| regex_compile_before::is_valid        | 78254   | 4.32%   |
+---------------------------------------+---------+---------+
| regex_compile_before::count_levels    | 41492   | 2.29%   |
+---------------------------------------+---------+---------+
compile_pattern accounts for ~92% of the captured CPU samples, making the bottleneck immediately obvious. This is much less apparent in the wall-clock report, where inclusive timing attributes the same execution time to main, parse_logs, is_valid, and compile_pattern along the call stack.
CPU attribution is exclusive by default, assigning samples only to the function where CPU time was actually spent. In this case, that different perspective points directly to compile_pattern as the function doing most of the work. This is a good example of why wall-clock and CPU profiling complement each other: they expose different aspects of the same execution.
How to avoid repeated Regex compilation in Rust
The fix is to compile the pattern once and reuse it - the standard tool is a LazyLock static, initialized on first use:
examples/regex_compile_after.rs
// The pattern is compiled once, on first use.
static LOG_LINE: LazyLock<Regex> =
    LazyLock::new(|| Regex::new(r"^\d{4}-\d{2}-\d{2} (ERROR|WARN|INFO) .+").unwrap());

#[hotpath::measure]
fn is_valid(line: &str) -> bool {
    LOG_LINE.is_match(line)
}
cargo run --release -p test-cpu --example regex_compile_after --features hotpath,hotpath-cpu
timing - Execution duration of functions.
+-----------------------------------+-------+-----------+-----------+----------+---------+
| Function                          | Calls | Avg       | P95       | Total    | % Total |
+-----------------------------------+-------+-----------+-----------+----------+---------+
| regex_compile_after::main         | 1     | 1.13 s    | 1.13 s    | 1.13 s   | 100.00% |
+-----------------------------------+-------+-----------+-----------+----------+---------+
| regex_compile_after::count_levels | 300   | 216.68 µs | 357.12 µs | 65.01 ms | 5.77%   |
+-----------------------------------+-------+-----------+-----------+----------+---------+
| regex_compile_after::parse_logs   | 1     | 3.51 ms   | 3.51 ms   | 3.51 ms  | 0.31%   |
+-----------------------------------+-------+-----------+-----------+----------+---------+
| regex_compile_after::is_valid     | 10000 | 283 ns    | 125 ns    | 2.83 ms  | 0.25%   |
+-----------------------------------+-------+-----------+-----------+----------+---------+

cpu - CPU sampling attribution per function (exclusive). (206256 total samples)
+-----------------------------------+---------+---------+
| Function                          | Samples | % Total |
+-----------------------------------+---------+---------+
| regex_compile_after::count_levels | 185733  | 90.05%  |
+-----------------------------------+---------+---------+
compile_pattern is gone, and with it most of the program’s CPU work. is_valid dropped from 163.17 µs to just 283 ns per call, cutting the total runtime roughly in half, from 2.15 s to 1.13 s.
The two reports complement each other. Wall-clock timing shows how long instrumented functions contribute to end-to-end execution, while CPU sampling reveals where the processor is actually doing work. After eliminating the original hotspot, count_levels accounts for ~90% of all CPU samples, making it the clear target for the next optimization round if the remaining 1.13 s matters.
This is also what profiling often looks like in practice: removing one bottleneck exposes the next. Looking at both wall-clock and CPU perspectives helps distinguish code that makes the program wait from code that actively consumes CPU.
Each cpu report also prints a samply load command - running it opens the recorded profile in an interactive flame-graph UI, useful for digging into the uninstrumented parts of the call tree.
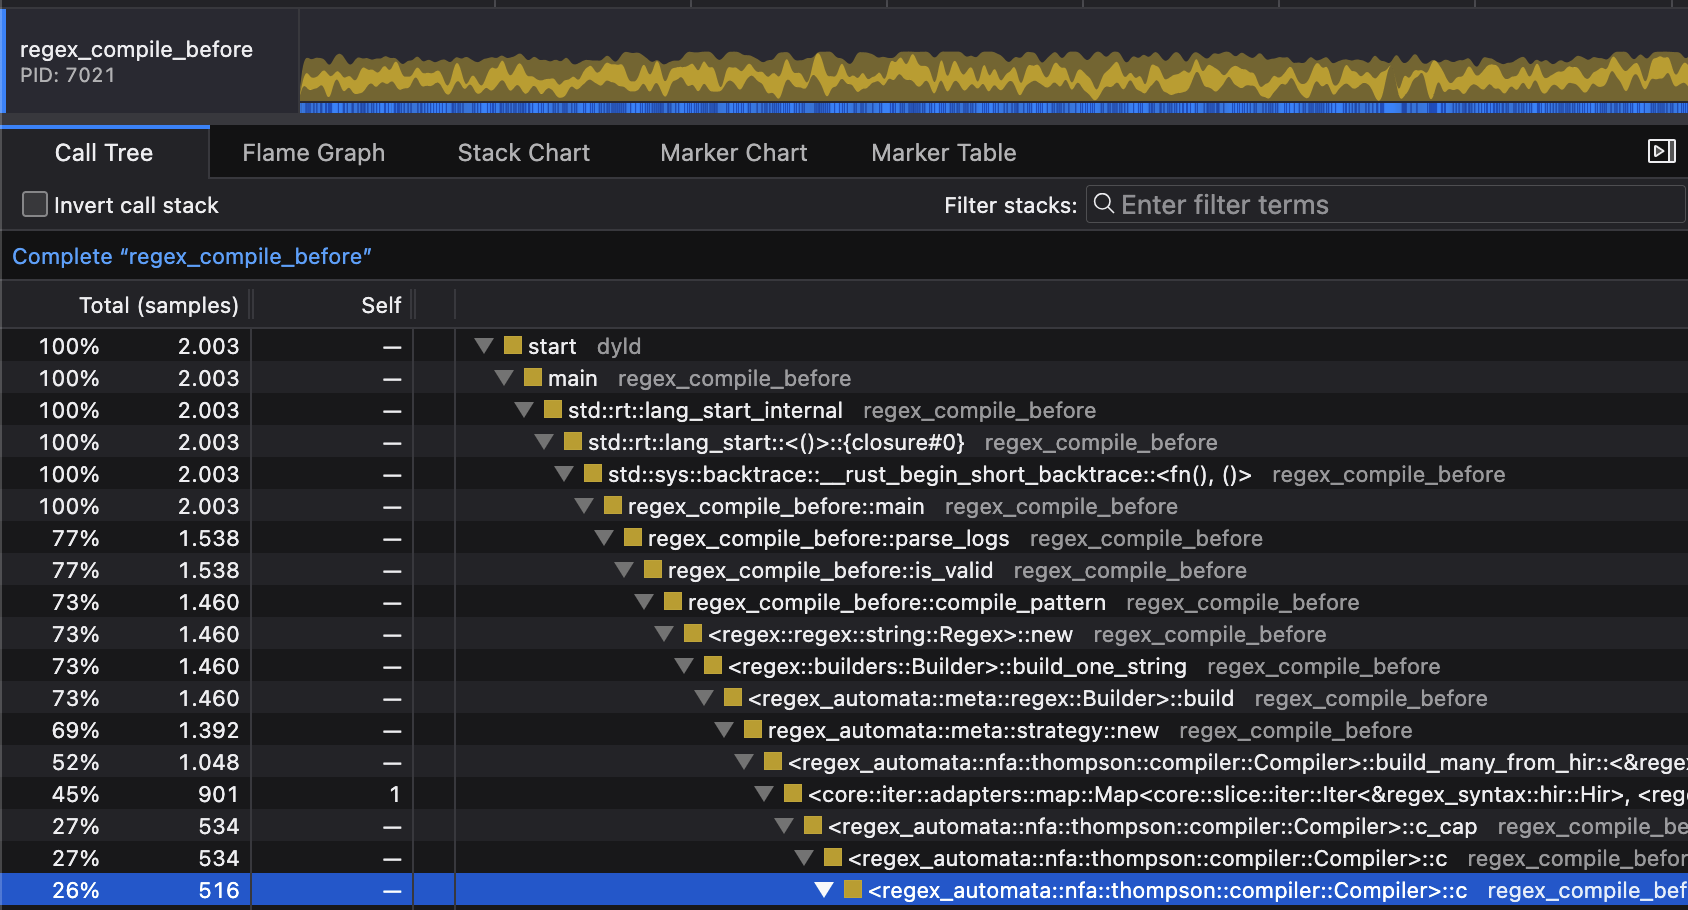
BTW although hotpath uses samply as the source of CPU traces, it interprets the profiling data differently than the samply UI. Attributions are weighted using the threadCPUDelta metric, preventing idle CPU time from being overrepresented in the report. This works well because time spent waiting or otherwise idle is already captured by the wall-clock report.
Wall-clock time
Visit the sampling comparison docs for an in-depth explanation of how wall-clock timing differs from CPU sampling. It’s especially useful for measuring async functions execution, because CPU sampling cannot correctly attribute futures runtime waiting time to correct functions.
Wall-clock is the last section in this tutorial. It’s by no means the least useful one - timing reports have simply been covered in most of the other sections already. I extensively use hotpath to profile itself via the hotpath-meta crate, see CONTRIBUTING.md for more details. Based on this experience, I find pure wall-clock timing useful, but due to its susceptibility to run-to-run noise, I prefer to use it as a secondary signal. I’ve seen deviations of up to 10%-15% on shared GitHub CI runners, and even locally, depending on what else is running on the system during a benchmark (especially when running on battery).
Even tools like criterion.rs or hyperfine cannot mitigate run-to-run variability completely. Statistical benchmarking reduces measurement noise within a run, but it can’t eliminate systematic differences between CI machines or workloads.
So if a function appears 15% faster but none of the more deterministic signals changed - it may simply reflect run-to-run or hardware variation. But if a function is consistently faster and also emits 30% fewer queries, or its hotpath::io! wrapper shows an I/O throughput improvement, then the change is likely significant.
hotpath-rs ecosystem adoption is slowly growing, and over 100 open-source projects have already integrated it. I regularly check how other projects use it, and I’ve noticed that most integrations are limited to the hotpath::measure and hotpath::measure_all macros.
In practice, combining hotpath::mutex!, channel!, io!, http!, and SQL tracing with wall-clock timing can provide more specific and, in some cases, more deterministic signals.
Summary
Having moved from Ruby on Rails performance consulting to working primarily with Rust, I keep exploring more effective ways to find and fix performance bottlenecks in Rust applications. I’m continuing to improve hotpath-rs based on what I learn, and feedback on the tool is always welcome.
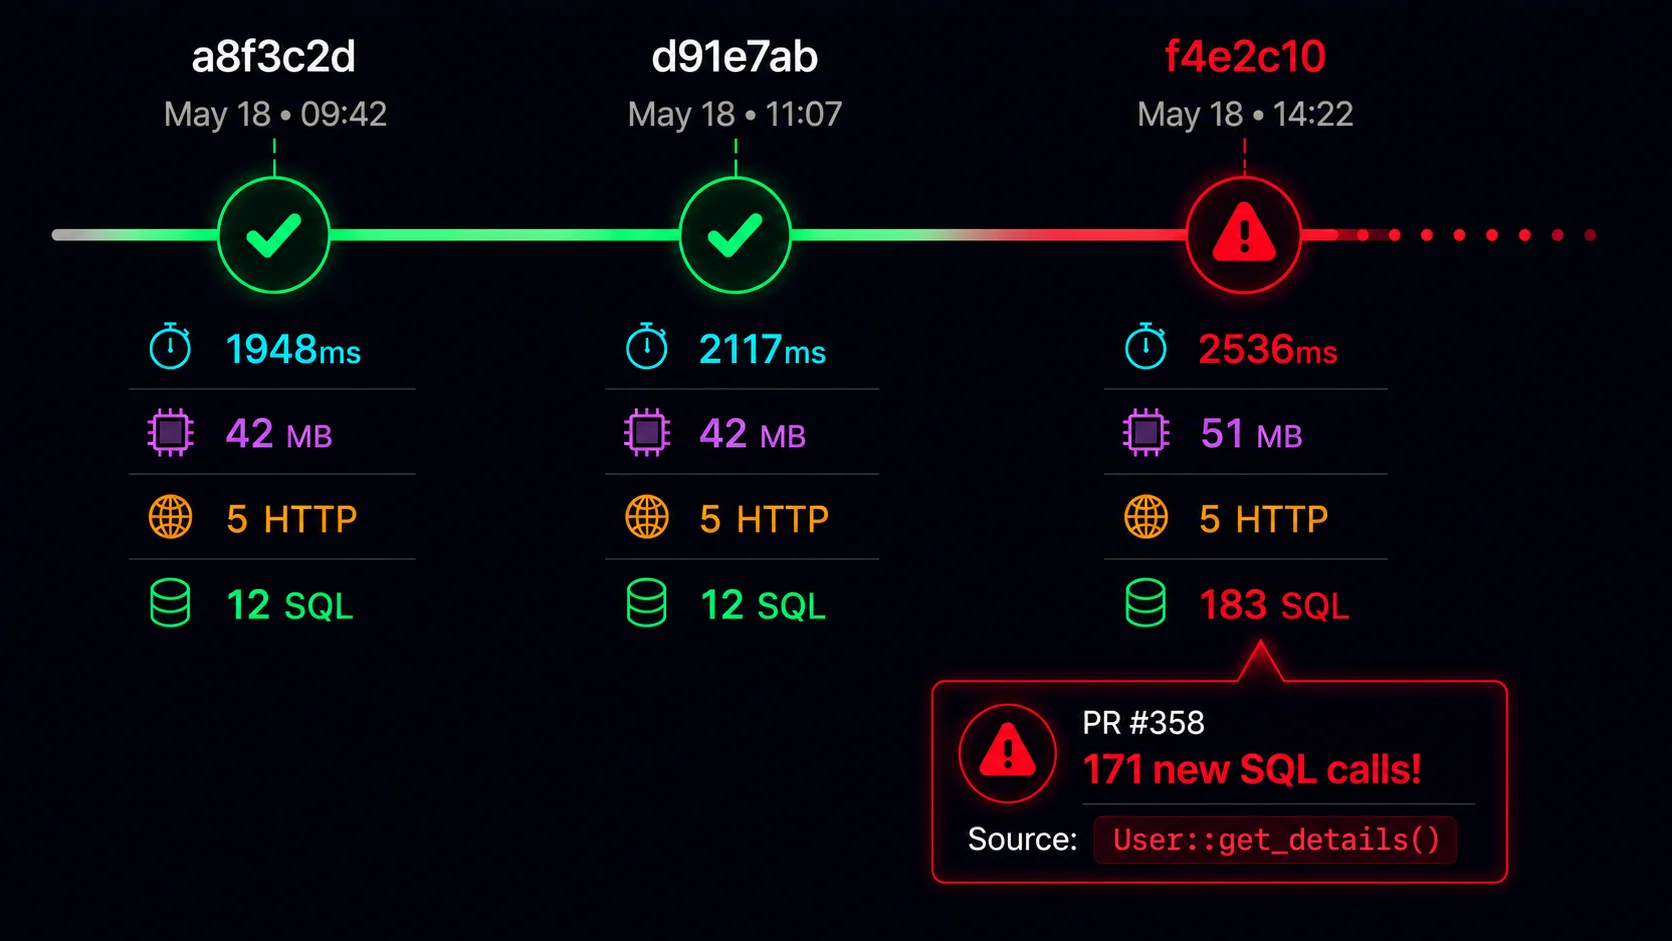
Finding bottlenecks locally is only part of the problem. The next step is making these performance signals useful throughout the development lifecycle - automatically catching when a PR adds N+1 SQL queries, bloats allocations, introduces lock contention, or makes a critical path slower.
That’s why I’m now building hotpath Diff: a hosted version of hotpath-rs for tracking performance changes across PRs and deployments. It detects regressions and makes before/after performance reports easier to interpret and share with your team.
I think this will become even more useful as AI agents write more code. Agents work best when they have clear constraints and fast feedback. Tests can tell them when behavior breaks, but performance is often missing from that feedback loop. hotpath Diff will provide agents clear performance constraints and help ensure that applications built with AI stay fast.
If you’d like to try it, join the hotpath Diff waitlist below for early access.
hotpath Diff - every Rust PR gets a performance review
Catch regressions in memory, SQL queries, HTTP calls and concurrency bottlenecks before they reach production. Iterate on reproducible signals, not CI noise.
Launching soon • Early access invitations will be sent to waitlist members first.
Building in public. Follow development progress on X: @pawelurbanekcom