Rust SQL Query Profiling for sqlx and Diesel
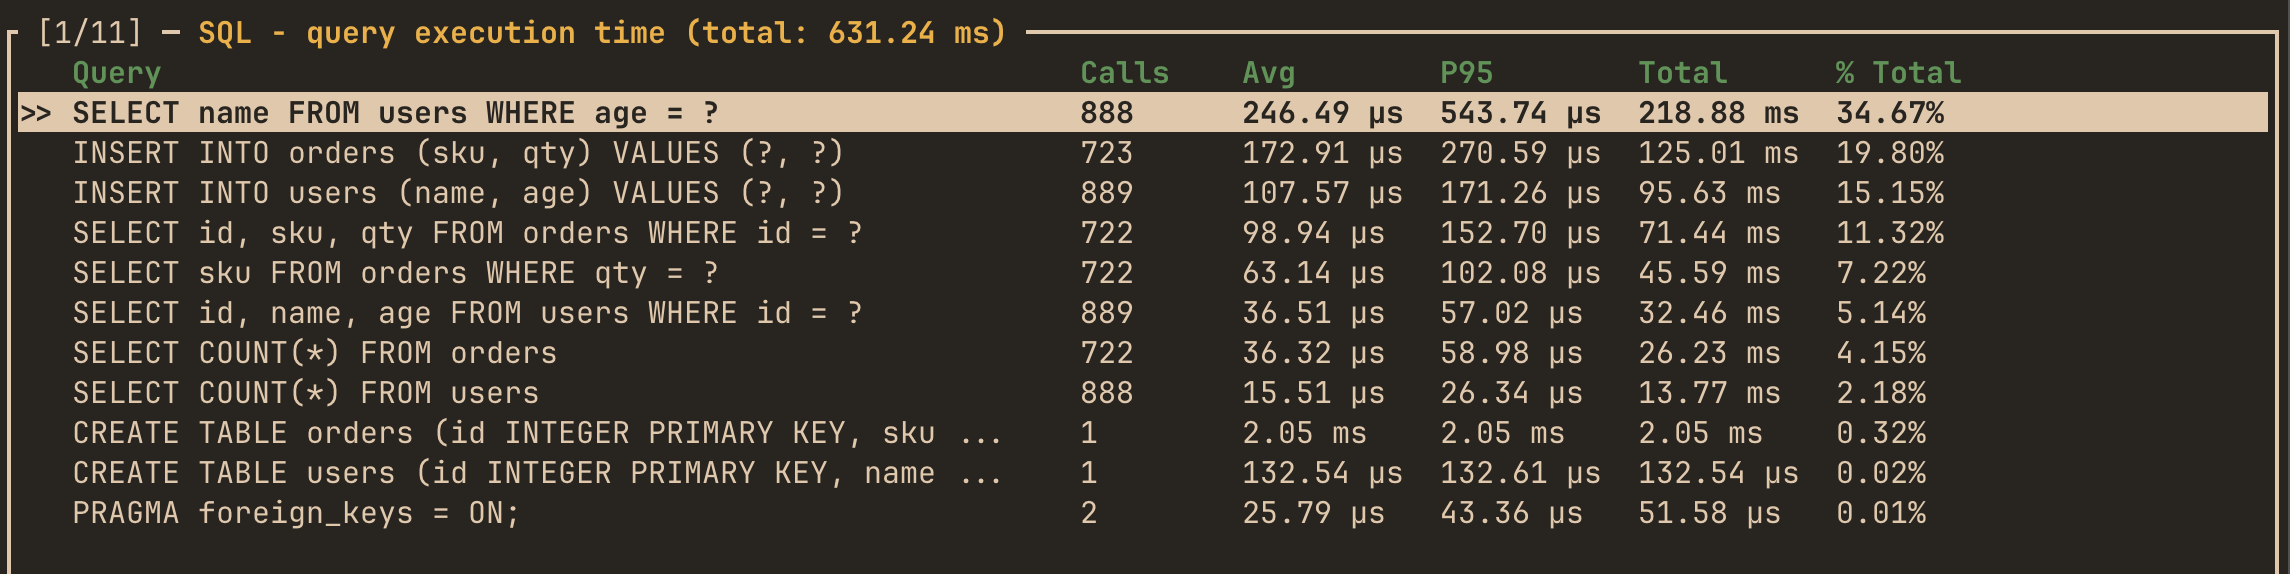
hotpath profiles SQL queries in Rust applications, helping you identify slow statements, repetitive query patterns, and unexpected database activity. Queries are grouped by their normalized SQL text, so parameterized executions of the same statement are reported together. For example, 1,000 executions of SELECT ... WHERE id = ? appear as a single entry with call count, average latency, percentiles, and total execution time.
The same profiling backend powers both sqlx and Diesel with more integrations coming soon. Instrumentation is inactive unless the hotpath feature is enabled.
Normalizing SQL queries
Queries are grouped by normalized text:
- single-quoted string literals become
? - numeric literals become
? - runs of
?inside anIN (...)list collapse toIN (?) - whitespace is squashed to single spaces
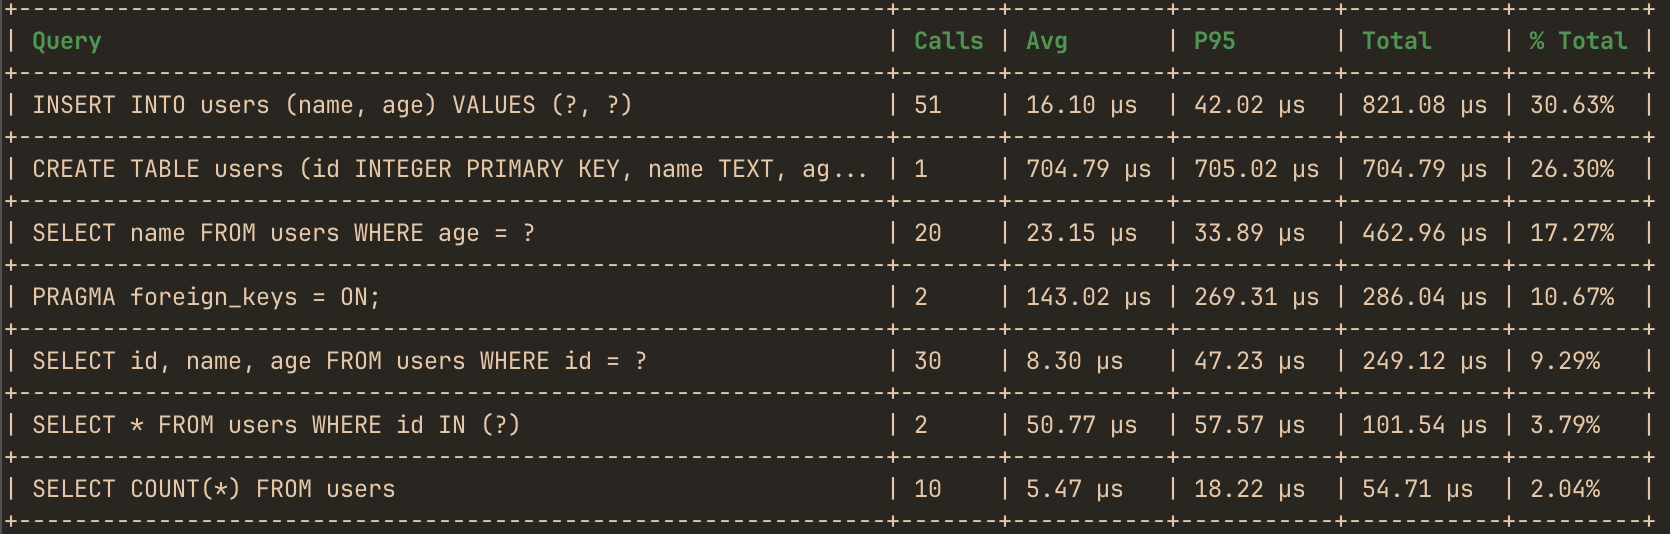
Only parameter-varied executions of the same statement merge - structurally different statements stay separate. So these two collapse into a single bucket (SELECT * FROM users WHERE id IN (?)):
SELECT * FROM users WHERE id IN (1, 2, 3)
SELECT * FROM users WHERE id IN (4, 5, 6, 7, 8)
Bound parameters never reach the report - only the statement shape does.
Profiling sqlx queries with a tracing layer
Add hotpath with the sqlx feature to your Cargo.toml:
[dependencies]
hotpath = "0.19", features=["sqlx"]
hotpath uses tracing_subscriber::Layer to capture sqlx query events with their timing info. Configure it like this:
use tracing_subscriber::prelude::*;

tracing_subscriber::registry()
    .with(hotpath::sqlx_tracing_layer())
    .init();
That’s it - every query executed through any sqlx pool or connection is now profiled.
EnvFilter caveat
A global EnvFilter (registry().with(env_filter)) runs before the hotpath layer’s own filter and can suppress the sqlx::query events for the whole stack, emptying the SQL report. Attach any EnvFilter per-layer instead, or make sure you don’t globally filter out the sqlx::query target.
Profiling Diesel queries with Instrumentation
Add hotpath with the diesel feature to your Cargo.toml:
[dependencies]
hotpath = "0.19", features=["diesel"]
Diesel emits nothing through tracing, so instead of a layer it exposes a custom callback trait. Install hotpath’s instrumentation before opening connections:
hotpath::instrument_diesel_sql();

// open connections AFTER this call so they pick up the instrumentation
let mut conn = SqliteConnection::establish(":memory:")?;
instrument_diesel_sql() registers the instrumentation as the default for every newly-established connection. Connections established before the call are not instrumented.
- Backend coverage is automatic - the trait lives in Diesel core, so Postgres, MySQL, and SQLite are all covered. Enable the matching Diesel backend feature in your own crate.
- Transaction control statements (
BEGIN,COMMIT,ROLLBACK,SAVEPOINT) are filtered out - the report stays queries-only. Queries inside a transaction are captured. - Synchronous connections only.
instrument_diesel_sql()registers Diesel’s global default instrumentation, which coversdiesel::Connectiontypes.diesel_asyncsupport is coming soon.
Adding the SQL section to your hotpath report
The sql section is opt-in. Add it via the HOTPATH_REPORT env var (comma-separated sql, or all), or programmatically through HotpathGuardBuilder::sections:
let _guard = hotpath::HotpathGuardBuilder::new("main")
    .sections(vec![hotpath::Section::Sql])
    .build();
Limiting and capping query output
The number of queries shown is unlimited by default (0). Cap it with:
- Macro:
#[hotpath::main(sql_limit = n)] - Builder:
.sql_limit(n) - Env var:
HOTPATH_SQL_LIMIT
Live SQL metrics
Live SQL queries metrics display in the I/O -> SQL TUI tab: