A simple Rust profiler that shows exactly why your code is slow
Profile CPU, memory, async execution, SQL and HTTP calls, I/O streams, lock contention and channels from a single tool.


Try the TUI demo via SSH - no installation required:
Or let your own AI agent configure profiling in a repo:
hotpath-rs is an easy-to-configure Rust performance profiling toolkit that shows exactly where your code spends time, burns CPU, and allocates memory.
It helps you distinguish between functions that are slow because they wait on I/O and those that are CPU-intensive. Instrument functions, channels, futures, streams, SQL queries, and byte-level I/O to find bottlenecks and focus optimizations where they matter most. Get actionable insights into time, memory, and async data flow with minimal setup.
Used by 114 open-source projects, including:


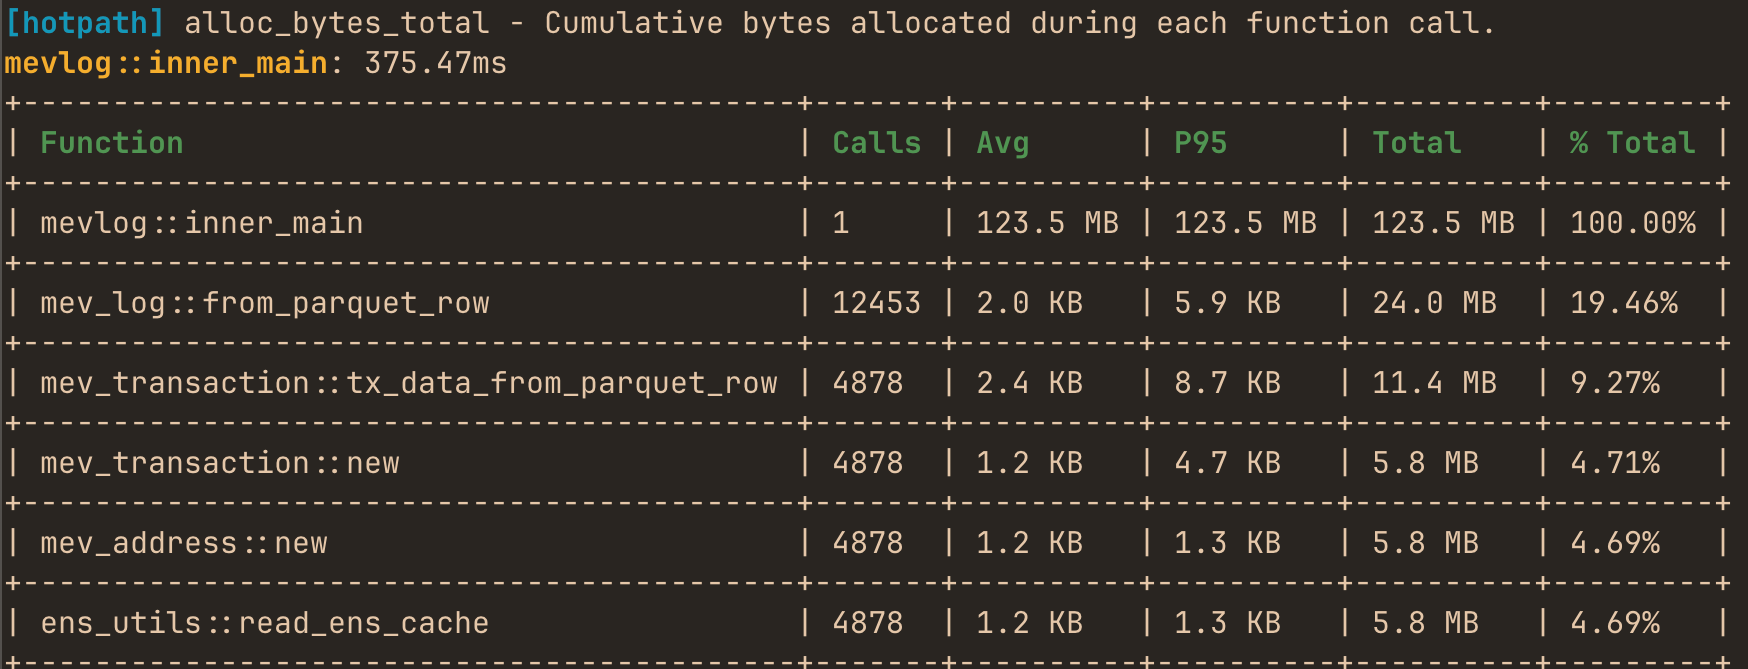
You can use it to produce one-off performance (timing, memory or CPU) reports:
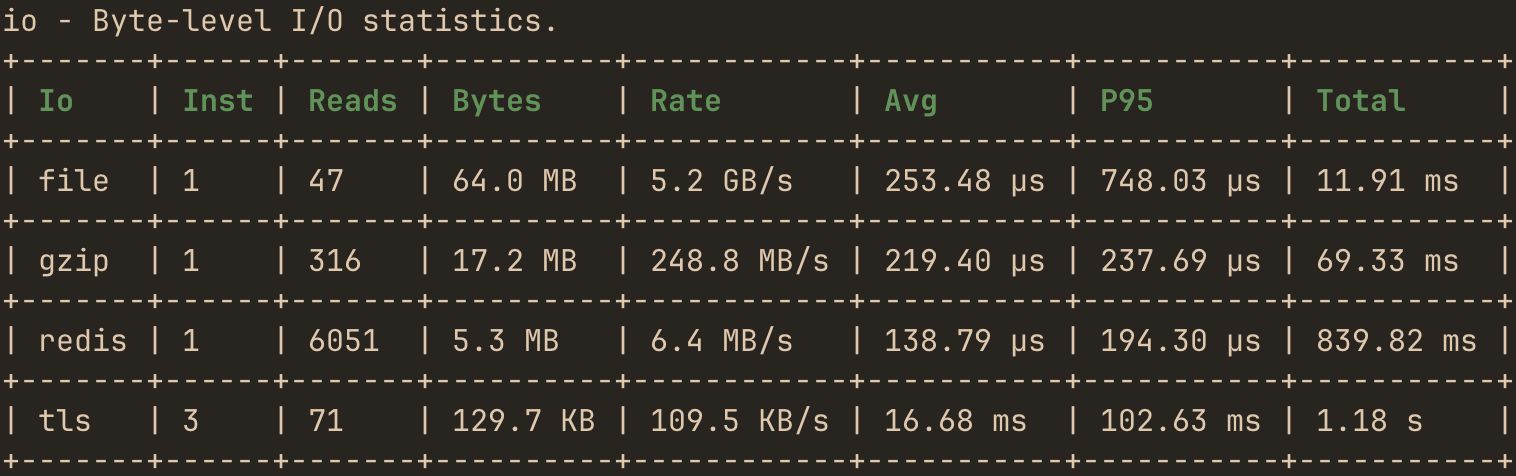
inspect throughput and latency of network, file or compression I/O streams:
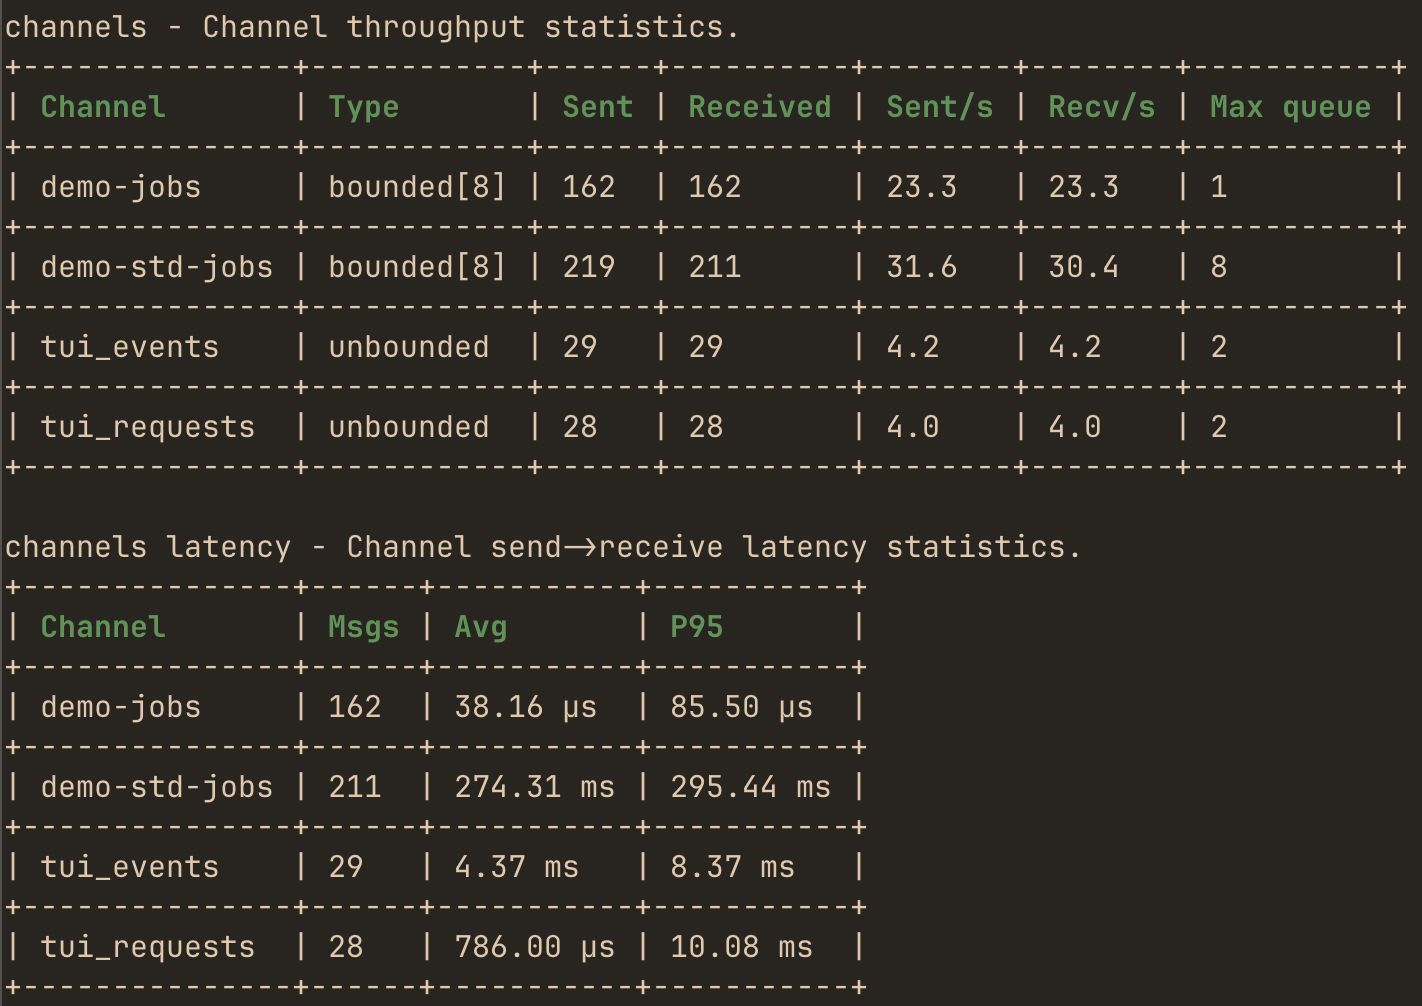
monitor throughput, performance and max queue depth of instrumented channels:
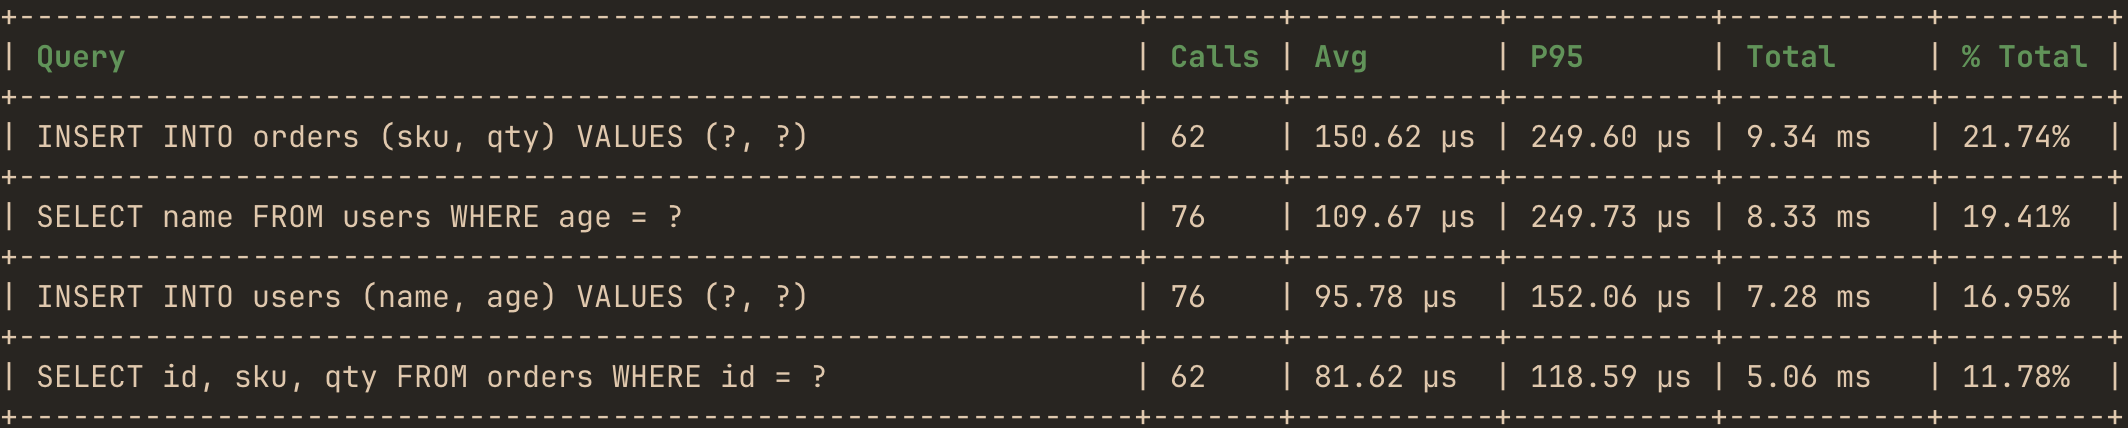
analyze SQL calls performance:
or use the live TUI dashboard to monitor real-time performance and async data flow metrics with debug info:
Features
- Time, CPU & memory profiling - identify expensive functions, allocation hotspots, and investigate memory leaks.
- Async observability - futures, channels and streams.
- I/O monitoring - bytes, throughput, latency of any sync or async IO stream like files, TCP, or compression.
- SQL query profiling - query performance metrics for sqlx and Diesel.
- HTTP calls profiling - per-endpoint latency and error metrics for reqwest.
- Concurrency metrics - Mutex/RwLock wait time and contention.
- Tokio runtime monitoring - workers, scheduling and queues.
- Live TUI dashboard & static reports - real-time or one-off analysis.
- CI regression detection - benchmark every PR automatically.
- MCP server for AI agents - query profiling data in real time.
- Zero cost when disabled - fully feature-gated.
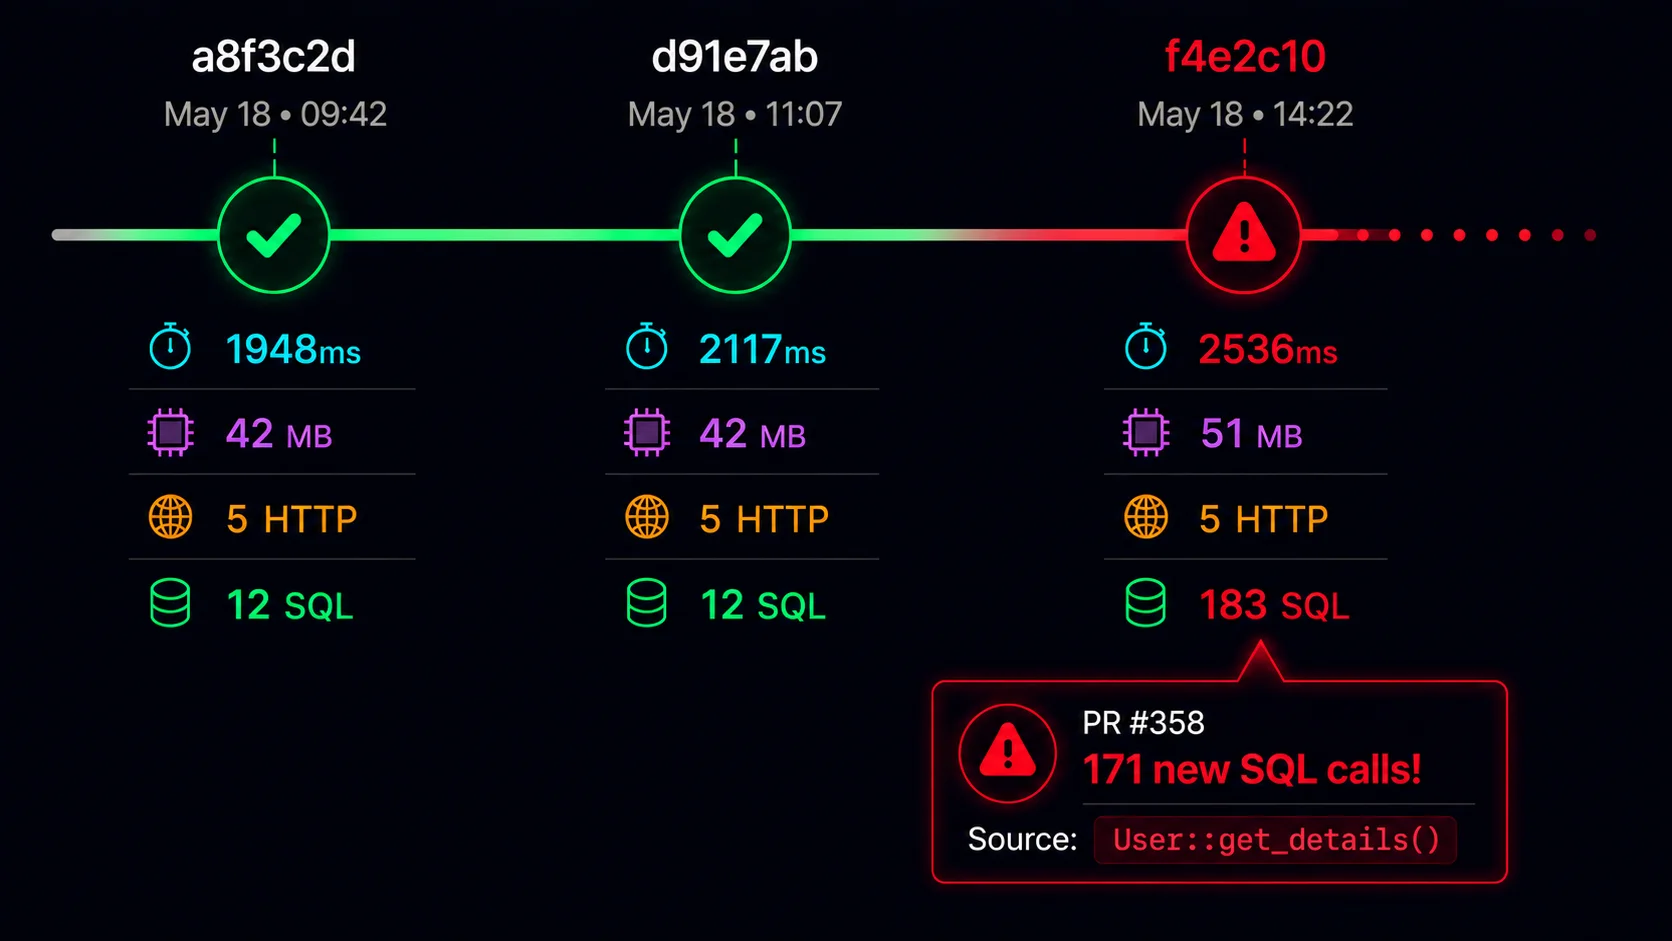
Every Rust PR gets a performance review.
Catch regressions in memory, SQL queries, HTTP calls and concurrency bottlenecks before they reach production. Iterate on reproducible signals, not CI noise.
Launching soon • Early access invitations will be sent to waitlist members first.
Building in public. Follow development progress on X: @pawelurbanekcom
Getting Started
AI Setup (Recommended)
The quickest way to set up hotpath is to let your own AI coding agent do it. Install the hotpath CLI and run init inside your project repo:
cargo install hotpath --version '^0.23'
hotpath init --agent claude # or --agent codex
hotpath init downloads the hotpath_init agent skill from GitHub and starts your installed Claude Code or Codex with it as setup instructions. The agent inspects your project, adds the dependency, instruments main and a starting set of functions, channels and locks, then verifies that everything compiles with profiling enabled and disabled.
Your agent remains in control: you review and approve edits through its regular permission prompts. Requires curl and the claude or codex CLI on PATH.
You can also install the skill directly, without the hotpath CLI:
mkdir -p ~/.claude/skills/hotpath_init
curl -fsSL https://raw.githubusercontent.com/pawurb/hotpath-rs/main/skills/hotpath_init/SKILL.md \
  -o ~/.claude/skills/hotpath_init/SKILL.md
Then run /hotpath_init in a Claude Code session.
Manual installation
Add to your Cargo.toml:
[dependencies]
hotpath = "0.23"

[features]
hotpath = ["hotpath/hotpath"]
hotpath-cpu = ["hotpath/hotpath-cpu"]
hotpath-alloc = ["hotpath/hotpath-alloc"]
This config ensures that the lib has no compile time or runtime overhead unless explicitly enabled via a hotpath feature. All the lib dependencies are optional (i.e. not compiled) and all macros are noop unless profiling is enabled.
Basic setup
You’ll need only #[hotpath::main] and #[hotpath::measure] macros to get started:
#[hotpath::measure]
fn sync_function(sleep: u64) {
    std::thread::sleep(Duration::from_nanos(sleep));
    let vec1 = vec![1, 2, 3];
    std::hint::black_box(&vec1); // force mem allocation
}

#[hotpath::measure]
async fn async_function(sleep: u64) {
    tokio::time::sleep(Duration::from_nanos(sleep)).await;
}

// When using with tokio, place the #[tokio::main] first
#[tokio::main]
#[hotpath::main]
async fn main() {
    for i in 0..1000 {
        sync_function(i);
        async_function(i * 2).await;

        hotpath::measure_block!("custom_block", {
            std::thread::sleep(Duration::from_nanos(i * 3))
        });
    }
}
Now, run your program with hotpath (and optionally hotpath-alloc) feature:
cargo run --features='hotpath,hotpath-alloc'
On exit it will print a report with timings, memory allocations and thread usage metrics:
[hotpath] 1.20s | timing, alloc, threads

timing - Function execution time metrics.
+------------------------------+-------+----------+----------+----------+---------+
| Function                     | Calls | Avg      | P95      | Total    | % Total |
+------------------------------+-------+----------+----------+----------+---------+
| docs_example::main           | 1     | 1.20 s   | 1.20 s   | 1.20 s   | 100.00% |
+------------------------------+-------+----------+----------+----------+---------+
| docs_example::async_function | 1000  | 1.15 ms  | 1.20 ms  | 1.15 s   | 96.10%  |
+------------------------------+-------+----------+----------+----------+---------+
| custom_block                 | 1000  | 18.13 µs | 31.71 µs | 18.13 ms | 1.51%   |
+------------------------------+-------+----------+----------+----------+---------+
| docs_example::sync_function  | 1000  | 16.58 µs | 27.63 µs | 16.58 ms | 1.38%   |
+------------------------------+-------+----------+----------+----------+---------+

alloc - Cumulative allocations during each function call (including nested calls).
+------------------------------+-------+---------+---------+---------+---------+
| Function                     | Calls | Avg     | P95     | Total   | % Total |
+------------------------------+-------+---------+---------+---------+---------+
| docs_example::main           | 1     | 63.0 KB | 63.1 KB | 63.0 KB | 100.00% |
+------------------------------+-------+---------+---------+---------+---------+
| docs_example::sync_function  | 1000  | 12 B    | 12 B    | 11.7 KB | 18.58%  |
+------------------------------+-------+---------+---------+---------+---------+
| custom_block                 | 1000  | 0 B     | 0 B     | 0 B     | 0.00%   |
+------------------------------+-------+---------+---------+---------+---------+
| docs_example::async_function | 1000  | 0 B     | 0 B     | 0 B     | 0.00%   |
+------------------------------+-------+---------+---------+---------+---------+

threads - Thread CPU and memory statistics. (RSS: 7.8 MB, Alloc: 2.1 MB, Dealloc: 304.3 KB, Diff: 1.8 MB)
+--------------+----------+------+------+----------+---------+-----------+----------+----------+----------+
| Thread       | Status   | CPU% | Max% | CPU User | CPU Sys | CPU Total | Alloc    | Dealloc  | Diff     |
+--------------+----------+------+------+----------+---------+-----------+----------+----------+----------+
| main         | Sleeping | 6.3% | 6.3% | 0.123s   | 0.070s  | 0.193s    | 367.8 KB | 9.9 KB   | 357.9 KB |
+--------------+----------+------+------+----------+---------+-----------+----------+----------+----------+
| thread_5     | Sleeping | -    | -    | 0.000s   | 0.000s  | 0.000s    | 640 B    | 24 B     | 616 B    |
+--------------+----------+------+------+----------+---------+-----------+----------+----------+----------+
Quick demo
Other than the SSH demo an easy way to quickly try the ratatui.rs-powered TUI is to run it in auto-instrumentation mode. The TUI process profiles itself and displays its own performance metrics in real time.
First, install hotpath CLI with auto-instrumentation enabled:
cargo install hotpath --features='tui,hotpath,hotpath-alloc' --version '^0.23'
Then launch the TUI:
hotpath
and you’ll see timing, memory and other metrics.
Make sure to reinstall it without the auto-profiling features so that you can also observe metrics of other programs!
cargo install hotpath --features='tui' --version '^0.23'
Learn more
Explore the docs for customization options and advanced profiling features.
- Profiling modes - static reports vs live TUI dashboard
- Profiling overhead - per-operation instrumentation cost and time sampling
- Functions - measure execution time and memory allocations
- CPU profiling - attribute CPU samples to instrumented functions
- Threads - monitor threads usage
- Async Data Flow - monitor channels, streams, and futures
- Locks - track Mutex and RwLock wait and hold times
- SQL queries - profile query execution time for sqlx and Diesel
- HTTP requests - profile reqwest client calls per endpoint
- I/O tracing - monitor bytes, throughput and duration of TCP, Redis, and file operations
- Tokio Runtime - monitor Tokio runtime worker stats and task scheduling
- Debug & Metrics - track custom values with dbg!, val!, and gauge! macros
- GitHub CI - automated benchmarking and regression detection in CI
- MCP Server - LLM integration via Model Context Protocol
- Cargo flamegraph alternatives - when to use
hotpathvs sampling profilers like perf and samply - Configuration - explore all config options