Profiling modes: static reports and live monitoring
hotpath supports two complementary approaches to Rust performance profiling and runtime monitoring.
Static reports
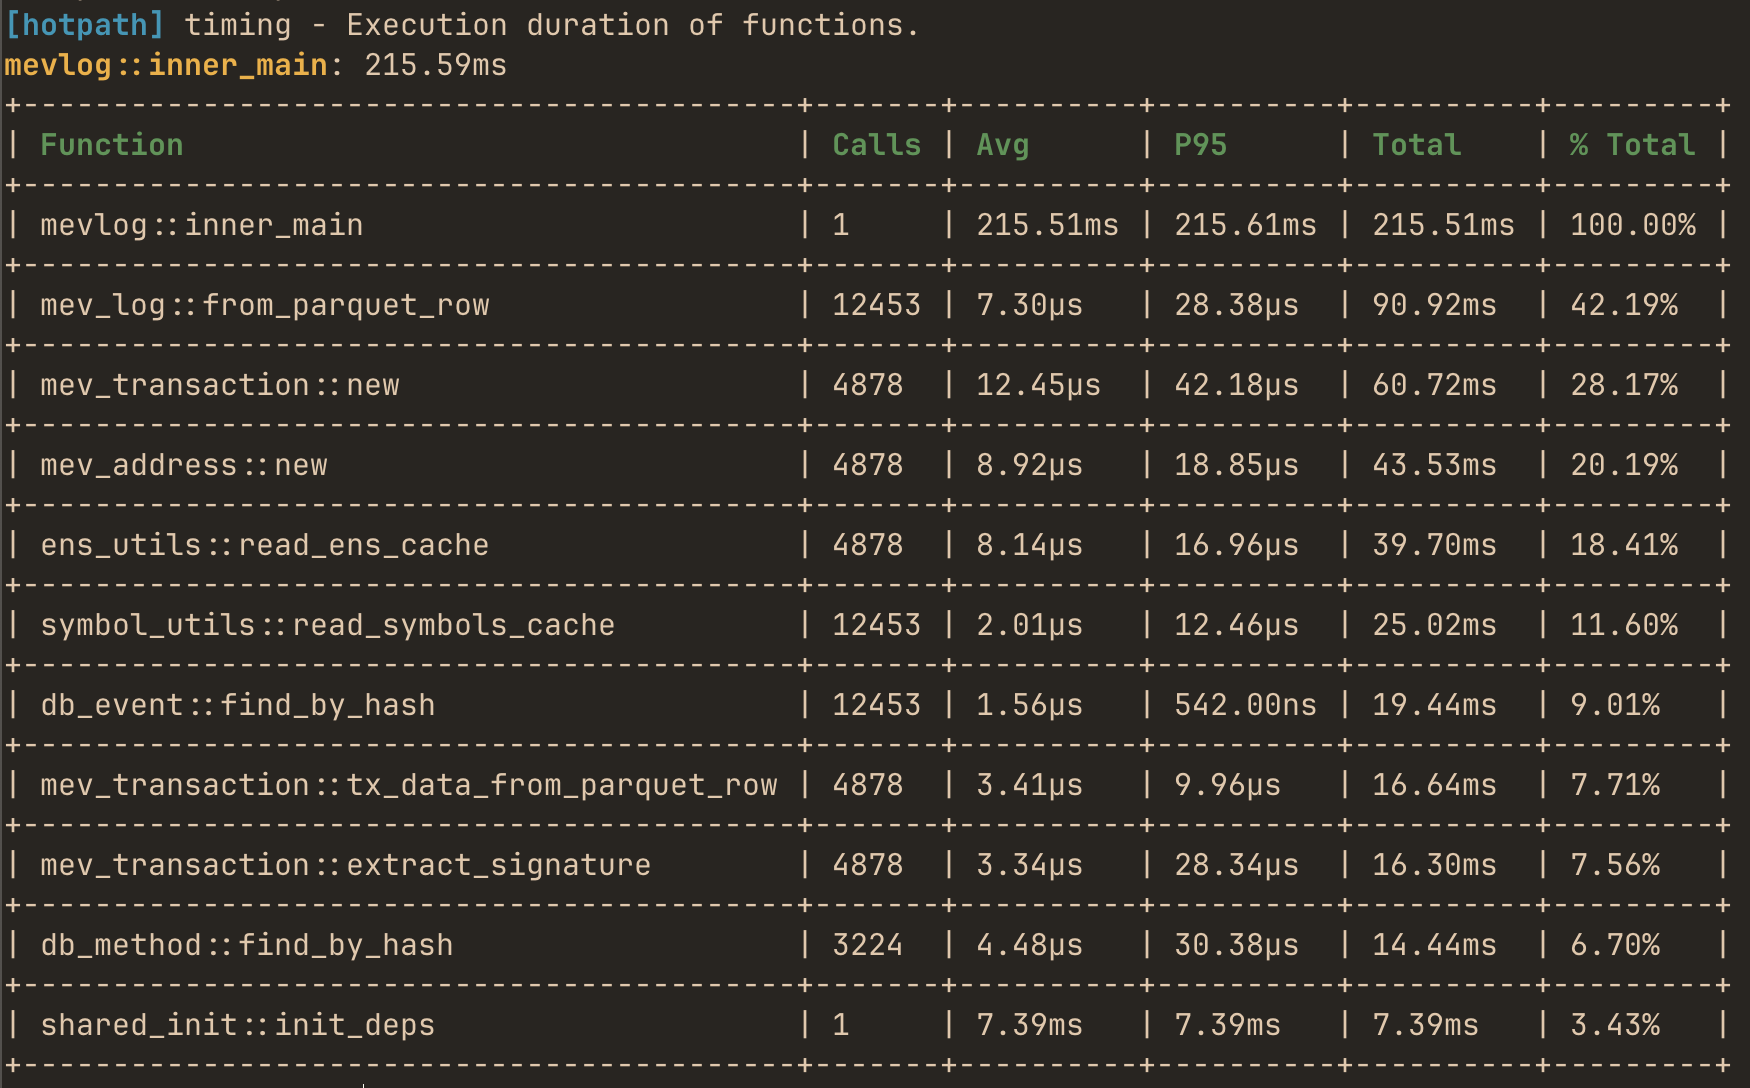
Best for CLI tools, tests, or short-lived applications. On exit, hotpath prints a summary of execution time, memory usage, and timing percentiles. Reports can be rendered as readable tables or exported as JSON for automated analysis.
Every instrumented program prints a performance report automatically when executed with the hotpath feature enabled.
cargo run --features=hotpath
Use --features='hotpath,hotpath-alloc' to print memory usage report:
cargo run --features='hotpath,hotpath-alloc'
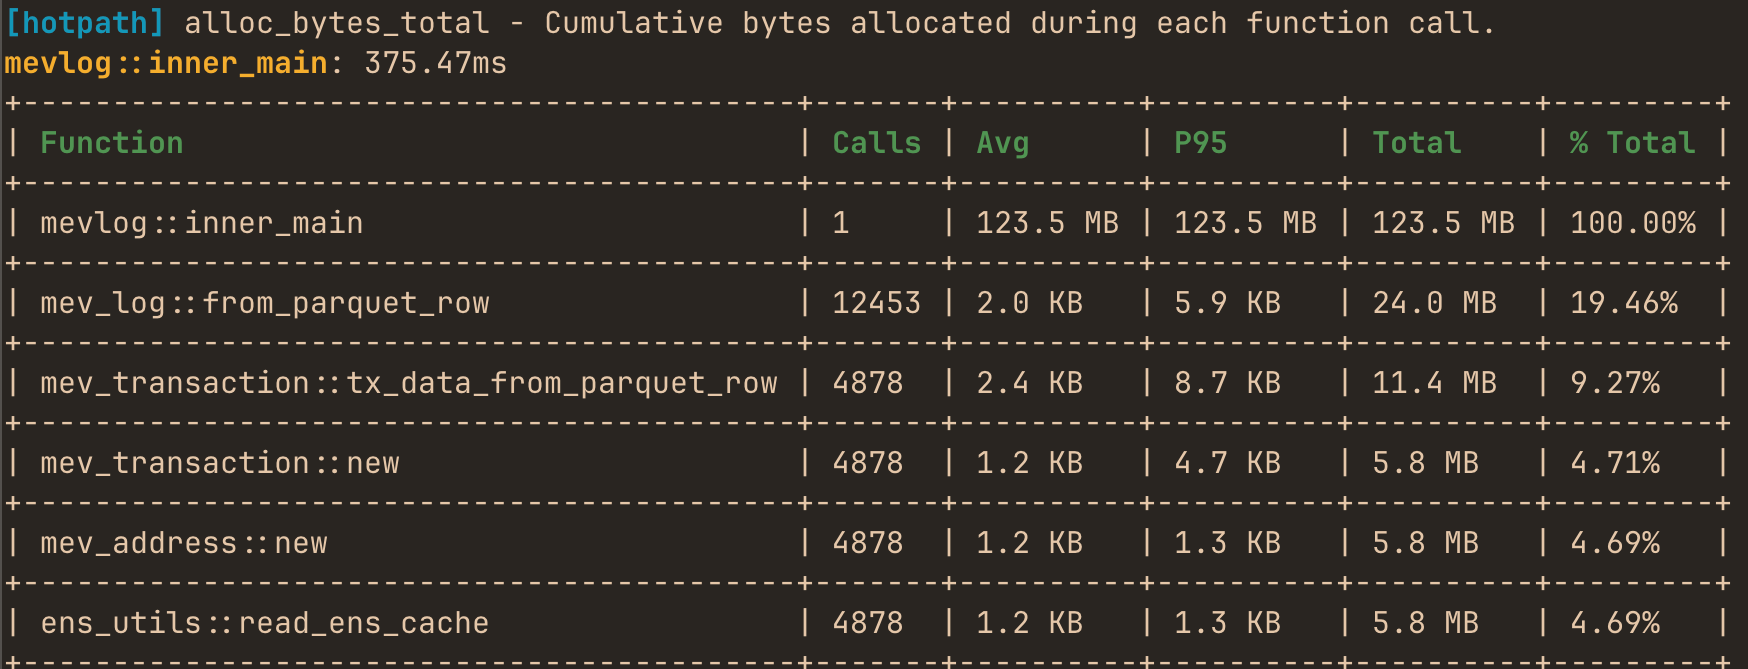
By default, allocation reports sort and display by bytes. Set HOTPATH_ALLOC_METRIC=count to use allocation count as the primary metric instead:
HOTPATH_ALLOC_METRIC=count cargo run --features='hotpath,hotpath-alloc'
hotpath::main vs HotpathGuardBuilder API
#[hotpath::main] is the simplest way to enable profiling. It creates a HotpathGuard for the entry-point function, and the profiling report is generated automatically when this function returns and that guard is dropped. You can use hotpath::main macro on any function not only main.
HotpathGuardBuilder gives you manual control over the profiling guard lifetime. The report is generated when the returned HotpathGuard is dropped. You can start profiling later, stop it earlier, or execute a custom logic using before_shutdown immediately before report generation.
#[hotpath::main]is best when you want profiling to cover the whole program entry point with minimal setup.HotpathGuardBuilderis best when you want to profile only part of a program, or control exactly when the report is generated.- Only one
HotpathGuardmay be alive at a time. Creating a second guard, whether from#[hotpath::main]orHotpathGuardBuilder, will panic.
Configuring limits
limit sets a global cap on items shown in every report section. Per-resource limits override the global value for that section:
// Global limit applies to all sections
#[hotpath::main(limit = 10)]
fn main() { /* ... */ }

// Per-resource limits override the global limit
#[hotpath::main(limit = 10, functions_limit = 20, channels_limit = 5)]
fn main() { /* ... */ }

// Set limit = 0 to display all instrumented resources without truncation
#[hotpath::main(limit = 0)]
fn main() { /* ... */ }
The same applies to the builder API - limit sets all sections, then individual setters override:
use std::time::Duration;

#[hotpath::measure]
fn example_function() {
    std::thread::sleep(Duration::from_millis(10));
}

fn main() {
    let guard = hotpath::HotpathGuardBuilder::new("my_program")
        .percentiles(&[95.0, 99.0])
        .limit(10)
        .functions_limit(20)
        .format(hotpath::Format::Table)
        .build();

    example_function();

    // Dropping the guard shuts down profiling and writes the report.
    drop(guard);

    // This exits immediately, so #[hotpath::main] would not generate a report.
    std::process::exit(1);
}
Configuring static reports
| Variable | Description |
|---|---|
HOTPATH_OUTPUT_FORMAT | Output format: table (default), json, json-pretty, or none. Using none silences output while keeping the metrics server and MCP server active. |
HOTPATH_OUTPUT_PATH | Filesystem path for profiling reports. If unset, reports are written to stdout. When set, this env var takes precedence over programmatic output_path config. On Unix, use /dev/stdout or /dev/stderr to redirect to the standard streams. |
HOTPATH_REPORT | Report sections spec: all, auto, an exact comma-separated list of section names, or auto with exclusions like auto,-threads. Defaults to auto - function and thread sections plus every instrumented section with data. |
HOTPATH_FOCUS | Filter profiled functions by name. Plain text does substring matching; wrap in /pattern/ for regex (e.g. HOTPATH_FOCUS="/^(compute|process)/"). |
HOTPATH_METRICS_SERVER_OFF | Set to true or 1 to disable the HTTP metrics server. Useful when you only need a static report and don’t want to use a TUI. |
Example - write a JSON report containing only function timing and thread usage metrics to a file:
HOTPATH_OUTPUT_FORMAT=json \
HOTPATH_OUTPUT_PATH=report.json \
HOTPATH_REPORT=functions-timing,threads \
cargo run --features=hotpath
Timed shutdown
HOTPATH_SHUTDOWN_MS forces the program to exit and print the report after a fixed duration. This is useful for profiling long-running processes (HTTP servers, workers) where you want to collect metrics for a predefined period without manual intervention. It also enables deterministic benchmarks - run the same workload for a fixed window across different git commits and compare the reports.
HOTPATH_SHUTDOWN_MS=10000 \
HOTPATH_OUTPUT_FORMAT=json \
HOTPATH_OUTPUT_PATH=tmp/report.json \
cargo run --features=hotpath
Use before_shutdown in the HotpathGuardBuilder API to run cleanup logic (flush connections, drain queues) before the report is generated.
Live TUI dashboard
Best for long-running processes like HTTP servers, or background workers. It continuously displays function performance metrics, allocation counters, and channel/stream throughput while the application is running. This mode helps diagnose runtime bottlenecks, queue buildup, and data flow issues that are not visible in static summaries.
Install the TUI with:
cargo install hotpath --features=tui
Run the dashboard:
hotpath console
Then launch your instrumented application (with hotpath feature enabled) in a separate terminal to see live performance metrics.
You can learn how to instrument any Rust program in the next sections.