Instrumentation vs sampling & flame graphs: picking the right Rust profiler
Reading time: 8 minutes
In this section, we’ll compare hotpath with established sampling profilers such as perf, flamegraph, and samply.
We’ll walk through three common Rust performance profiling scenarios - CPU-bound code, blocking I/O, and async I/O - to show how the runtime metrics from sampling profilers differ from hotpath instrumentation (in some cases, the results are completely different).
To make sense of these differences, we’ll go beyond the profiling output itself. We’ll briefly dig into how Rust I/O works under the hood, how parked threads spend time waiting, and how the Tokio runtime schedules and wakes async tasks.
We will use sampling reports from samply. But the same fundamental behavior applies to both perf and flamegraph, as they all rely on periodic CPU sampling. You can follow the examples by cloning the project repo and installing the dependencies:
git clone [email protected]:pawurb/hotpath-rs.git
cargo install samply
CPU-bound work
Let’s start with the CPU-bound example:
#[hotpath::measure]
fn heavy_work(iterations: u32) -> u64 {
    let mut result: u64 = 1;
    for i in 0..iterations {
        result = result.wrapping_mul(black_box(i as u64).wrapping_add(7));
        result ^= result >> 3;
    }
    result
}

#[hotpath::measure]
fn light_work(iterations: u32) -> u64 {
    let mut result: u64 = 0;
    for i in 0..iterations {
        result = result.wrapping_add(black_box(i as u64));
    }
    result
}

#[hotpath::main]
fn main() {
    let mut total: u64 = 0;

    for _ in 0..1000 {
        total = total.wrapping_add(heavy_work(500_000));
        total = total.wrapping_add(light_work(100_000));
    }
}
This program runs two CPU-bound functions in a tight loop: one intentionally expensive (heavy_work) and one relatively cheap (light_work).
Running it with --features=hotpath produces the following report:
cargo run --example profile_cpu --features hotpath --profile profiling
[hotpath] timing - Execution duration of functions.
profile_cpu::main: 210.02ms
+-------------------------+-------+-----------+-----------+-----------+---------+
| Function                | Calls | Avg       | P95       | Total     | % Total |
+-------------------------+-------+-----------+-----------+-----------+---------+
| profile_cpu::main       | 1     | 209.92 ms | 209.98 ms | 209.92 ms | 100.00% |
+-------------------------+-------+-----------+-----------+-----------+---------+
| profile_cpu::heavy_work | 1000  | 169.91 µs | 254.72 µs | 169.91 ms | 80.94%  |
+-------------------------+-------+-----------+-----------+-----------+---------+
| profile_cpu::light_work | 1000  | 38.21 µs  | 51.26 µs  | 38.21 ms  | 18.20%  |
+-------------------------+-------+-----------+-----------+-----------+---------+
Let’s compare it to the samply report:
cargo build --example profile_cpu --profile profiling
samply record ./target/profiling/examples/profile_cpu

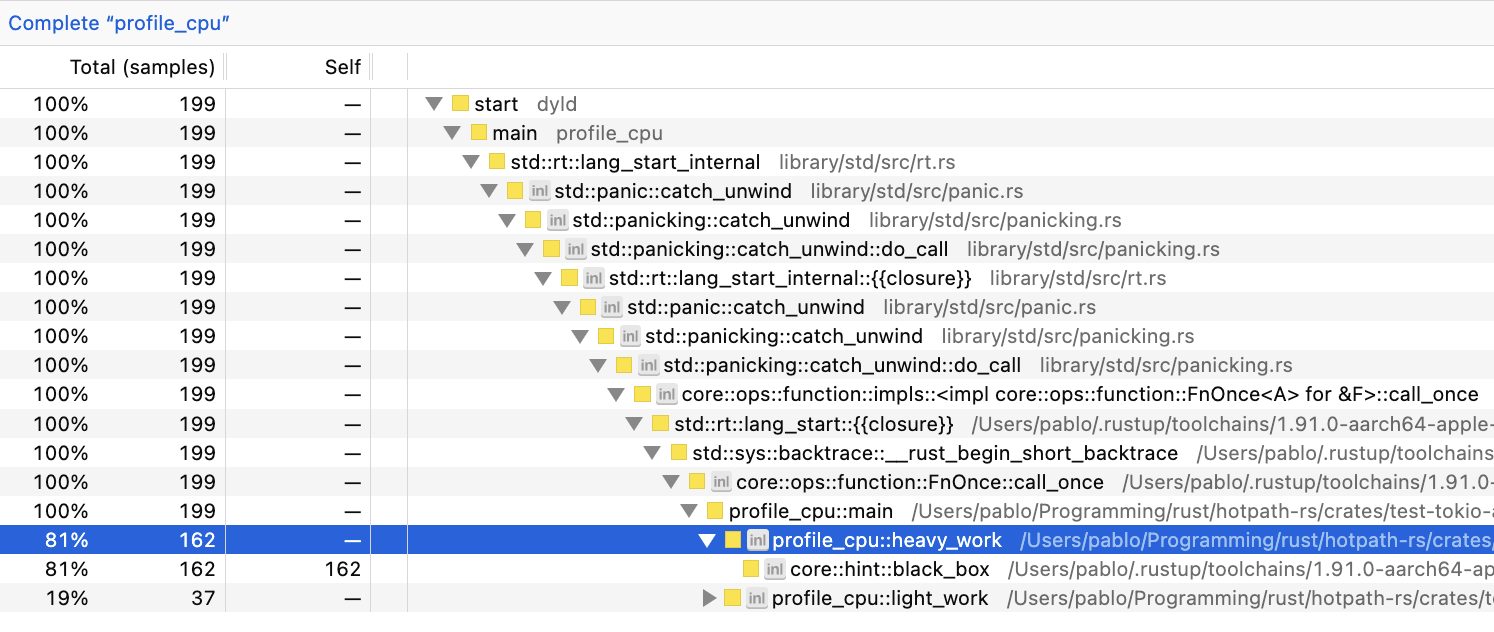
We can see that both profile_cpu::heavy_work and profile_cpu::light_work have similar ratios of total processing/CPU time regardless of the measurement method. Minor differences are expected from normal execution variability.
For statistically significant performance benchmarks, criterion.rs is usually a great choice. criterion excels at answering "is this faster?", whereas hotpath can help you answer the question of "why is my system slow?".
Blocking I/O
Let’s now analyze the blocking IO-bound example:
examples/profile_blocking_io.rs
const FILE_SIZE: usize = 10 * 1024 * 1024; // 10 MB
const CHUNK_SIZE: usize = 8 * 1024; // 8 KB

#[hotpath::measure]
fn create_test_file(path: &str) {
    let mut file = File::create(path).expect("create");
    let buf = vec![0xABu8; CHUNK_SIZE];

    for _ in 0..(FILE_SIZE / CHUNK_SIZE) {
        file.write_all(&buf).expect("write");
    }

    file.sync_all().expect("sync");
}

#[hotpath::measure]
fn read_file(path: &str) -> Vec<u8> {
    let file = File::open(path).expect("open");
    let mut reader = BufReader::with_capacity(CHUNK_SIZE, file);
    let mut data = Vec::with_capacity(FILE_SIZE);
    reader.read_to_end(&mut data).expect("read");
    data
}

#[hotpath::main]
fn main() {
    let path = "/tmp/hotpath_blocking.bin";
    create_test_file(path);

    for _ in 0..5 {
        let _data = read_file(path);
    }

    let _ = std::fs::remove_file(path);
}
The program writes a 10 MB file to disk in 8 KB chunks, then reads the entire file into memory a few times using blocking I/O.
Profiling it with hotpath produces this report:
cargo run --example profile_blocking_io --features hotpath --profile profiling
profile_blocking_io::main: 18.23ms
+---------------------------------------+-------+-----------+----------+----------+---------+
| Function                              | Calls | Avg       | P95      | Total    | % Total |
+---------------------------------------+-------+-----------+----------+----------+---------+
| profile_blocking_io::main             | 1     | 18.10 ms  | 18.10 ms | 18.10 ms | 100.00% |
+---------------------------------------+-------+-----------+----------+----------+---------+
| profile_blocking_io::create_test_file | 1     | 12.99 ms  | 12.99 ms | 12.99 ms | 71.77%  |
+---------------------------------------+-------+-----------+----------+----------+---------+
| profile_blocking_io::read_file        | 5     | 956.59 µs | 1.26 ms  | 4.78 ms  | 26.42%  |
+---------------------------------------+-------+-----------+----------+----------+---------+
and with samply:
cargo build --example profile_blocking_io --profile profiling
samply record ./target/profiling/examples/profile_blocking_io

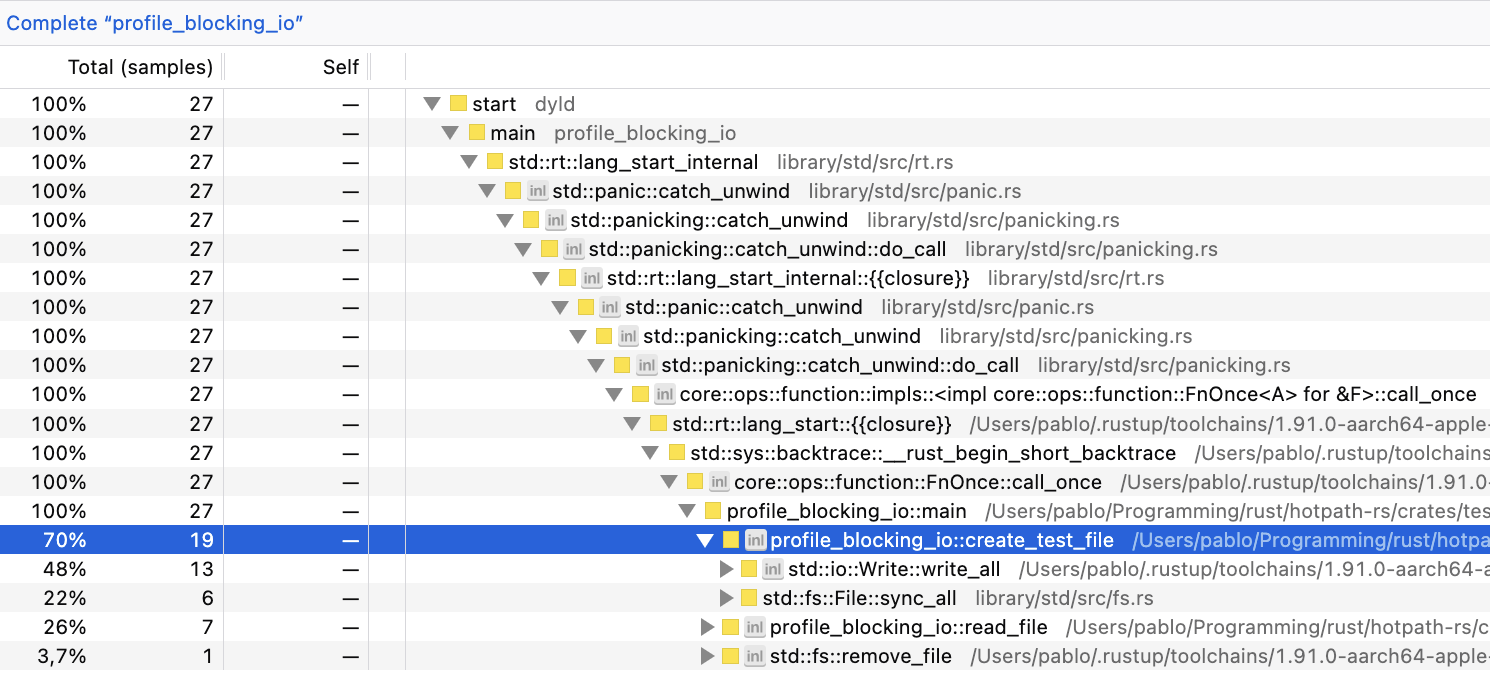
In this example, there’s more variation than in the CPU-bound one. But profile_blocking_io::create_test_file usually takes 67%-75% and profile_blocking_io::read_file 21%-29%.
So far, both profilers output comparable numbers. So what’s the point of using hotpath, while it requires manual instrumentation?
Let’s move on to the last example.
Async I/O
const FILE_SIZE: usize = 20 * 1024 * 1024; // 20 MB
const CHUNK_SIZE: usize = 8 * 1024; // 8 KB
const NUM_FILES: usize = 5;

#[hotpath::measure]
async fn create_file(path: &str) {
    let mut file = File::create(path).await.expect("create");
    let buf = vec![0xABu8; CHUNK_SIZE];
    for _ in 0..(FILE_SIZE / CHUNK_SIZE) {
        file.write_all(&buf).await.expect("write");
    }
    file.sync_all().await.expect("sync");
}

#[hotpath::measure]
async fn read_file(path: &str) -> Vec<u8> {
    let file = File::open(path).await.expect("open");
    let mut reader = tokio::io::BufReader::new(file);
    let mut data = Vec::with_capacity(FILE_SIZE);
    reader.read_to_end(&mut data).await.expect("read");
    data
}

#[tokio::main(flavor = "current_thread")]
#[hotpath::main]
async fn main() {
    let paths: Vec<String> = (0..NUM_FILES)
        .map(|i| format!("/tmp/hotpath_async_{i}.bin"))
        .collect();
    let path_refs: Vec<&str> = paths.iter().map(|s| s.as_str()).collect();

    let futures: Vec<_> = path_refs.iter().map(|p| create_file(p)).collect();
    join_all(futures).await;

    let futures: Vec<_> = path_refs.iter().map(|p| read_file(p)).collect();
    join_all(futures).await;

    for path in &paths {
        tokio::fs::remove_file(path).await.ok();
    }
}
This program concurrently creates a few 20 MB files using async Tokio I/O, writing them in 8 KB chunks, then concurrently reads all files back into memory. It runs on a single-threaded flavor = "current_thread" Tokio runtime, leveraging async I/O APIs from tokio::fs and tokio::io.
Let’s profile it with hotpath:
cargo run --example profile_async_io --features hotpath --profile profiling
profile_async_io::main: 166.70ms
+-------------------------------+-------+-----------+-----------+-----------+---------+
| Function                      | Calls | Avg       | P95       | Total     | % Total |
+-------------------------------+-------+-----------+-----------+-----------+---------+
| profile_async_io::create_file | 5     | 137.05 ms | 150.60 ms | 685.26 ms | 411.65% |
+-------------------------------+-------+-----------+-----------+-----------+---------+
| profile_async_io::main        | 1     | 166.46 ms | 166.59 ms | 166.46 ms | 100.00% |
+-------------------------------+-------+-----------+-----------+-----------+---------+
| profile_async_io::read_file   | 5     | 11.70 ms  | 11.80 ms  | 58.51 ms  | 35.14%  |
+-------------------------------+-------+-----------+-----------+-----------+---------+
Things just got interesting! Apparently, profile_async_io::create_file accounted for >400% of the total processing time. We will explain it in a moment.
Let’s compare it to the samply report:

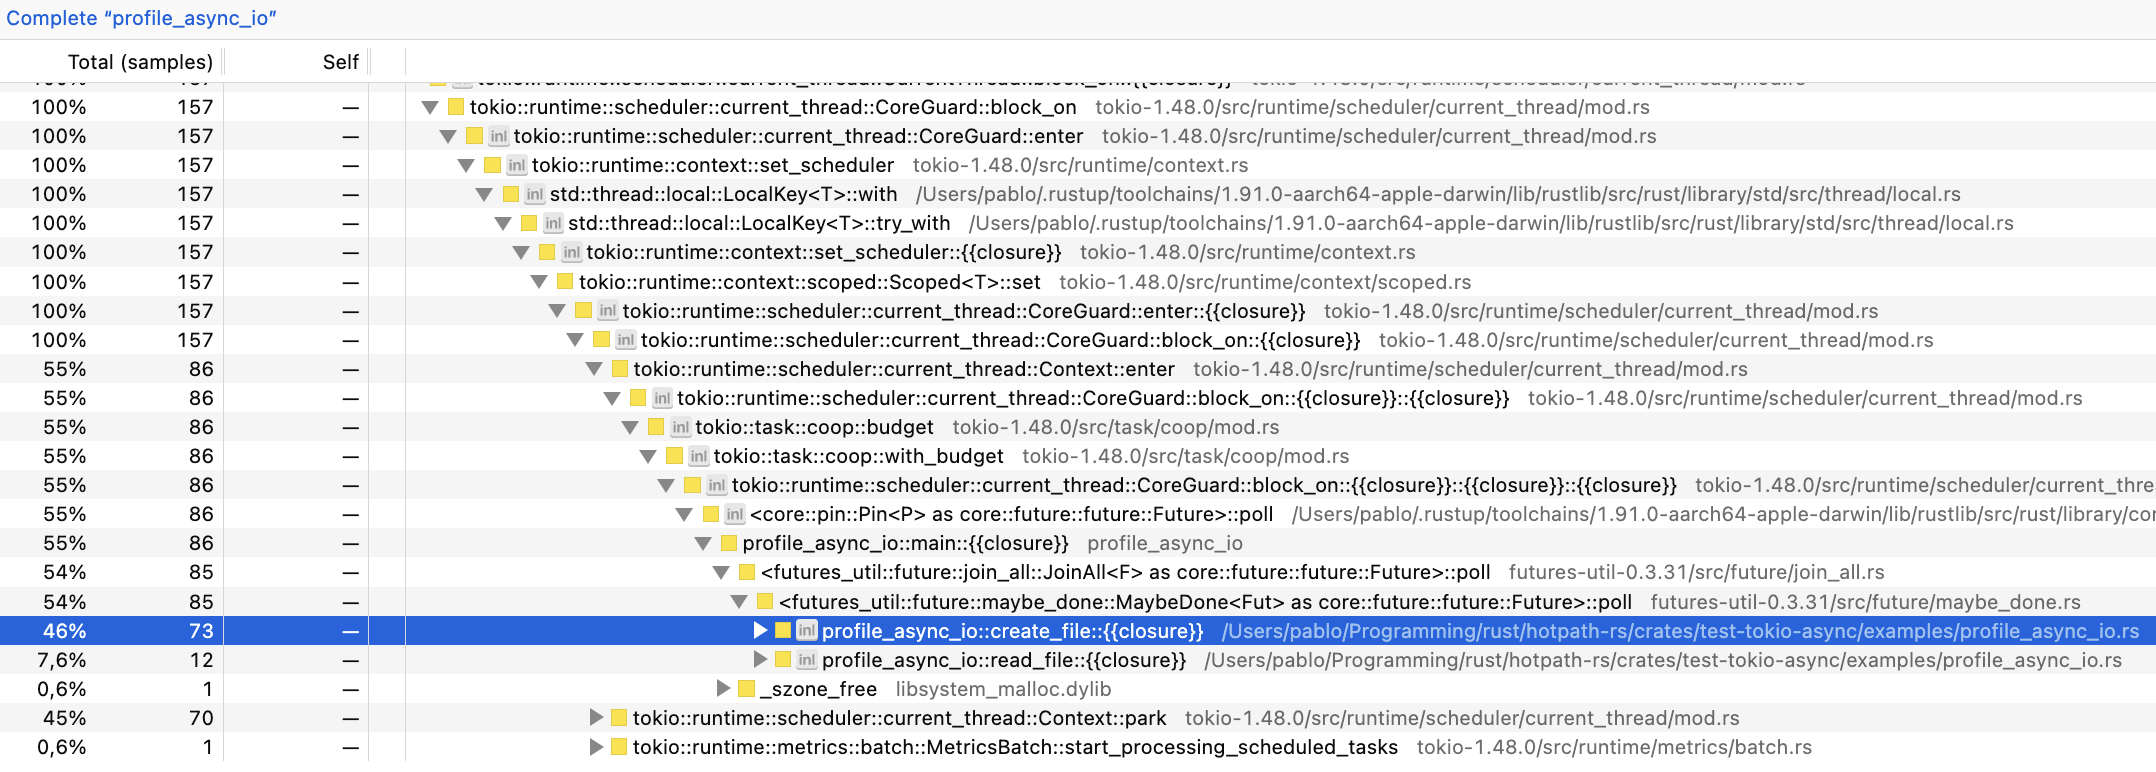
samply output is now significantly more verbose because of the Tokio runtime calls. And we can see that perf numbers are completely different from hotpath!
+-------------------------------+-----------+-----------+
| Function                      | hotpath   |  samply   |
+-------------------------------+-----------+-----------+
| profile_async_io::create_file | ~410%     | ~45%      |
| profile_async_io::read_file   | ~35%      | ~8%       |
+-------------------------------+-----------+-----------+
What’s going on?
Neither of these outputs is wrong; they just measure completely different things. To explain it, we will need to dive deeper into how Rust’s async runtime works.
BTW, it was supposed to be a quick docs entry that eventually evolved into a full-blown blog post. But I hope you’re still with me.
Sampling vs guards
Sampling profilers, like samply monitor a running program by periodically interrupting it and recording what it is doing at that instant. In an async runtime like Tokio, a sampling profiler can produce misleading-looking results, not because it’s wrong, but because it samples executor mechanics, not logical async work.
hotpath, on the other hand, works by instantiating guard objects with an internal timer for each instrumented method. When the method completes execution, measured timing (or memory usage) is reported using a custom guard Drop trait implementation.
It means that, unlike sampling profilers, hotpath calculates the exact time each async method took to execute, including the time spent sleeping while waiting for async I/O to complete.
hotpath measured profile_async_io::create taking over 400% of execution time, because it includes all the waiting time. That’s the core of Rust’s async I/O: multiple futures can await at the same time, effectively parallelizing work. BTW, check out hotpath::future! macro to get detailed insights into Rust futures lifecycle.
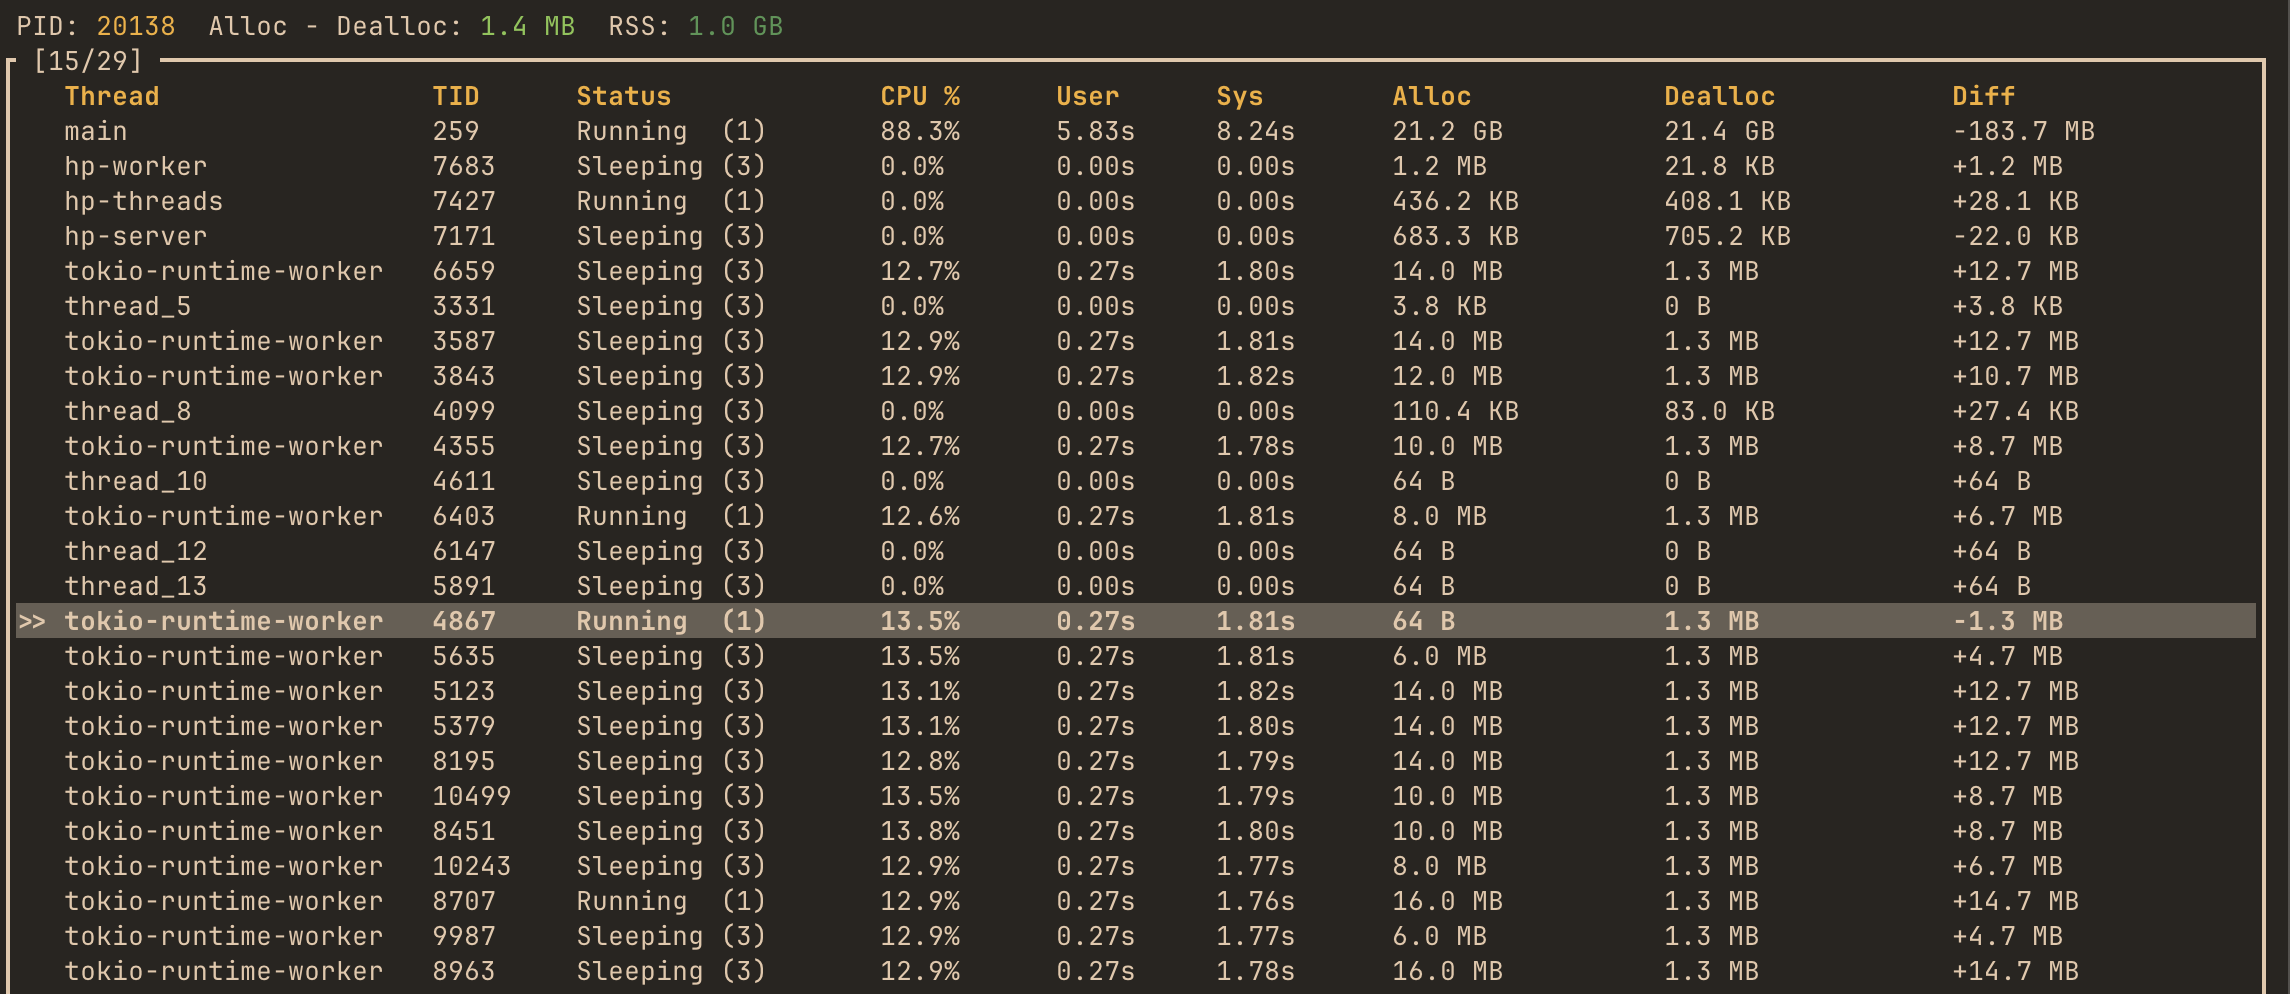
hotpath’s threads monitoring feature lets us peek under the hood at how Tokio implements async I/O. Apparently, despite running in a current_thread mode, Tokio still spawns multiple worker threads. To confirm it, you can run a profile_async_io_long.rs example, and check its thread usage with the hotpath console TUI:

It shows multiple tokio-runtime-worker threads somewhat busy (~13% CPU), toggling between running and sleeping states. I don’t have much exp with Tokio internals. But based on my research, Tokio can use separate threads, parking them while waiting for blocking system I/O calls to complete. That’s why profile_async_io::create took over 400% of the total run time in a supposedly single-threaded context.
Summary
Sampling profilers and hotpath measure fundamentally different aspects of program behavior. Tools like perf, flamegraph, or samply excel at answering "where is CPU time spent?" by observing which threads are executing at a given moment. It makes them ideal for CPU-bound workloads. However, they largely ignore wall-clock time spent waiting on I/O, locks, or async awaits - because nothing is running on the CPU during those periods.
hotpath takes a different approach: it measures logical execution time of instrumented functions, including time spent awaiting async I/O or being parked by the runtime. This makes it particularly effective for understanding real application behavior in I/O-heavy and async systems, where the dominant cost is often waiting rather than computation. In our examples we used file reads and writes to simulate I/O, but the same behavior applies to operations such as HTTP requests, SQL database queries, or RPC calls.
In practice, the two approaches complement each other. Use sampling profilers to optimize hot CPU paths and runtime internals; use hotpath to understand end-to-end latency and "why the system feels slow?" from the user’s point of view. For most non-trivial Rust systems, you’ll get the clearest picture by using both.
In the following sections, you’ll learn how to instrument the key parts of your program - functions, channels, streams, and more - to gain clear, actionable insight into its behavior.
- Profiling modes - static reports vs live TUI dashboard
- Functions - measure execution time and memory allocations
- Async Data Flow - monitor channels, streams, and futures
- Threads - monitor threads usage
- Tokio Runtime - track Tokio runtime metrics
- MCP integration - AI tool integration
- GitHub CI integration - benchmark PRs automatically
- Configuration - customize profiling behavior