Rust Threads performance monitoring: CPU and memory metrics
The threads view shows live per-thread CPU and memory metrics for the instrumented process. Reach for it when you need to answer questions that function-level profiling can’t: which thread is burning CPU, which thread’s allocations keep growing, or which threads sit blocked while the rest of your Tokio app starves. It works on Linux, macOS and Windows, and it’s enabled by default via the threads feature flag, so if you already use hotpath for time, CPU and memory profiling, per-thread monitoring is active out of the box.
Enabling per-thread monitoring
Add hotpath to your Cargo.toml behind feature flags:
[dependencies]
hotpath = "0.23"

[features]
hotpath = ["hotpath/hotpath"]
hotpath-alloc = ["hotpath/hotpath-alloc"]
and attach the #[hotpath::main] macro to your entry point:
#[hotpath::main]
fn main() {
    // your code
}
Then run with profiling enabled:
cargo run --features='hotpath,hotpath-alloc'
A few things to know:
threadsis a default feature of the hotpath crate, so no extra flag is needed - thread monitoring runs whenever thehotpathfeature is on.- The per-thread Alloc / Dealloc / Diff columns require the
hotpath-allocfeature. Without it you still get CPU and status metrics. - There is zero compile-time or runtime overhead when the
hotpathfeature is disabled - all macros become noops and dependencies are not compiled. - The sampling interval defaults to 250ms and is tunable via
HOTPATH_THREADS_INTERVAL_MS. The number of rows in the final report is capped byHOTPATH_THREADS_LIMIT(default: 5).
Metrics reference
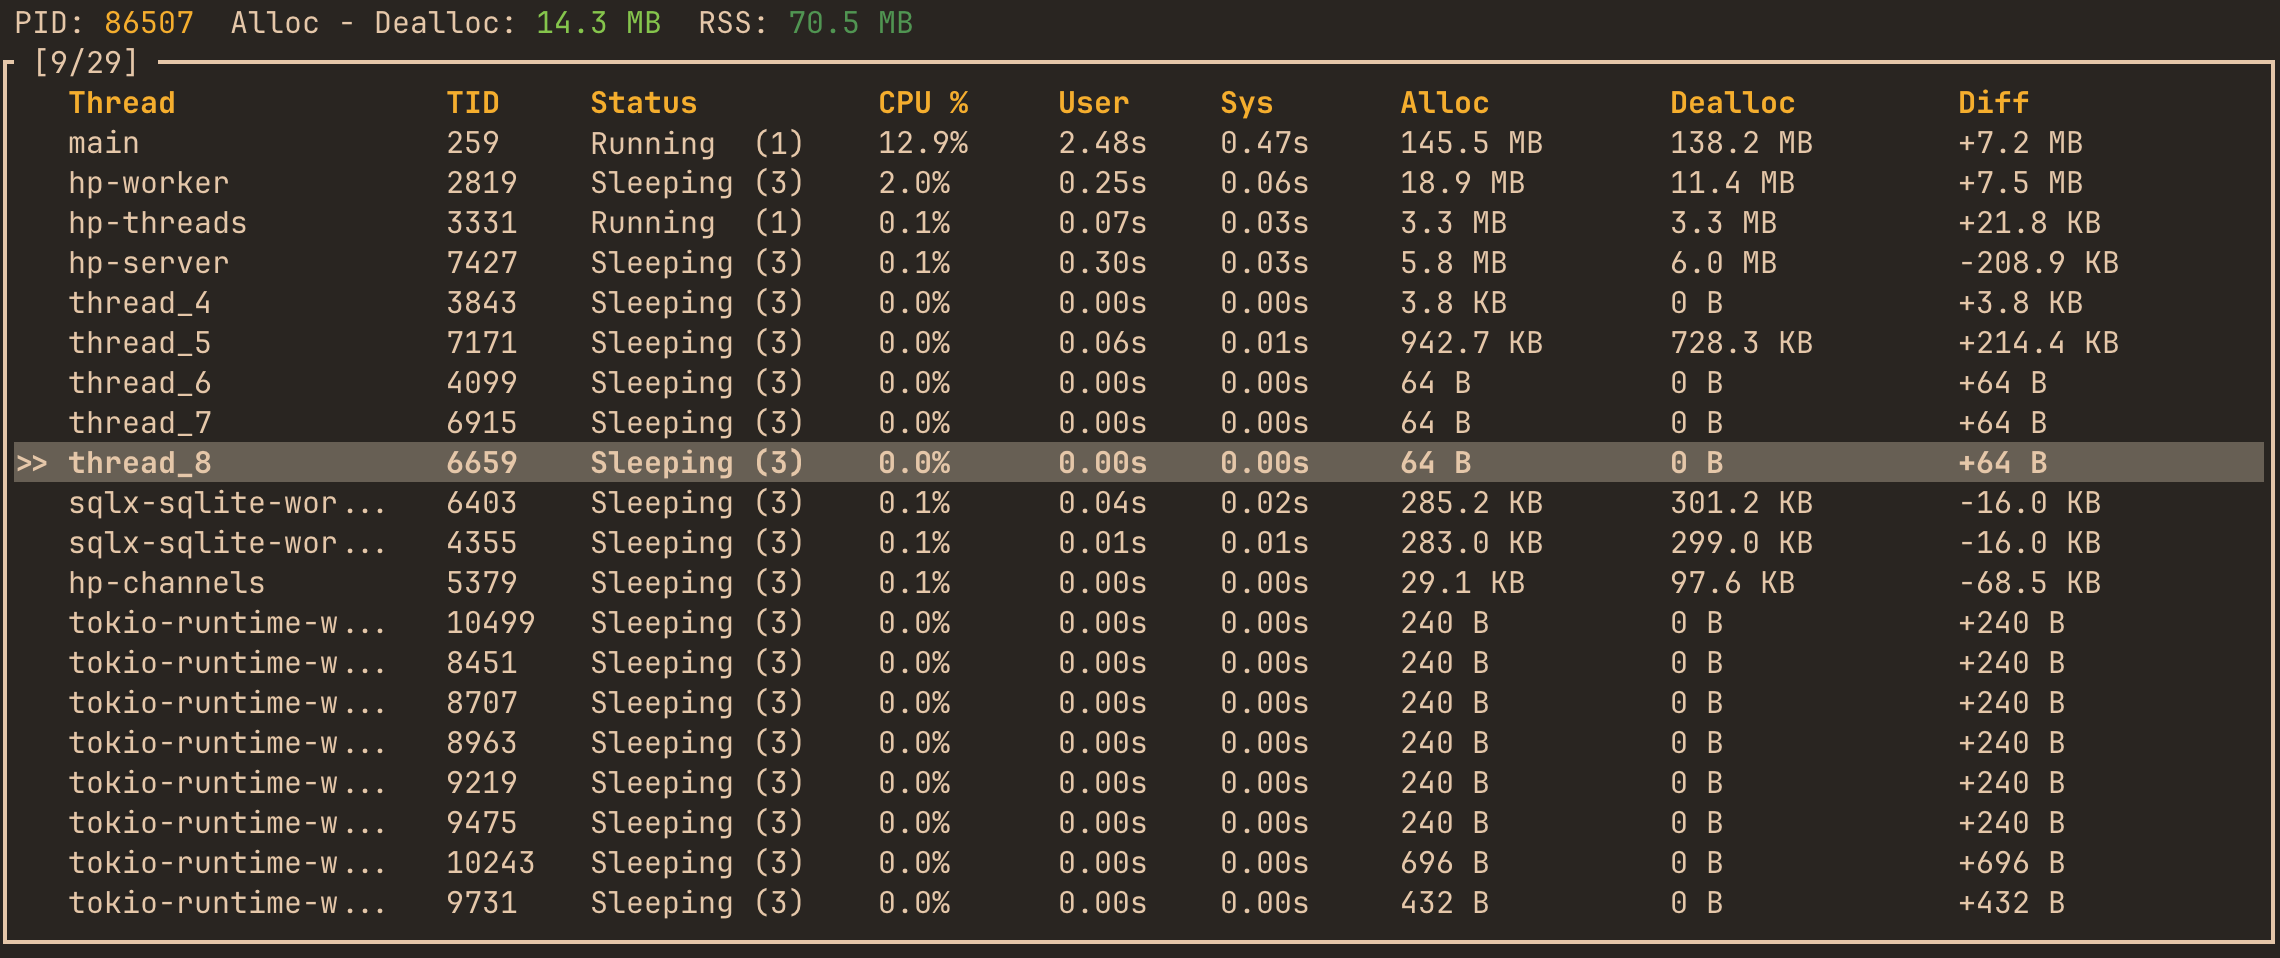
The view header shows process-wide numbers:
PID - the process identifier. Use it to correlate hotpath’s view with ps, top or htop.
Total Alloc - Dealloc - the aggregate allocation delta across all threads. If this number keeps growing while your app is under steady-state load, memory is being retained somewhere - a leak signal worth chasing down.
RSS - Resident Set Size, the physical memory the process currently occupies. RSS includes code, thread stacks and allocator slack, so it can stay flat while the allocation Diff grows (the allocator reuses freed pages) or grow while Diff stays flat. Comparing the two tells you whether memory growth comes from your allocations or from elsewhere.
And per-thread metrics:
Thread Name - the logical name set via std::thread::Builder::name or by the runtime (e.g. tokio-runtime-w). Unnamed threads show up as thread_N, so naming the threads you spawn makes this view far more useful.
TID - the OS thread identifier. It matches what htop -H, gdb and sampling profilers report, so you can cross-reference the same thread across tools.
Status - the current execution state. Running means on-CPU right now. Sleeping means parked or waiting - completely normal for idle Tokio workers. Blocked means an uninterruptible wait, usually disk I/O; a thread that is persistently Blocked is doing synchronous I/O that stalls it, which is especially bad inside async worker threads.
CPU % - instantaneous CPU utilization, computed from deltas of cumulative CPU time between 250ms samples. A worker pinned near 100% indicates a busy loop or heavy computation. Max% preserves the peak value, so short spikes don’t disappear between refreshes.
User / Sys Time - cumulative user-mode vs kernel-mode CPU time. A high sys share points at syscall churn: many tiny I/O operations, lock contention or excessive polling. A high user share means your own code is doing the computing.
Alloc / Dealloc - total bytes allocated and deallocated, attributed to the thread that performed them. Requires the hotpath-alloc feature.
Diff - Alloc minus Dealloc for that thread. A Diff that keeps climbing on a long-running thread is the per-thread leak signal; jump to the functions allocation view to find which function is responsible.
Reading the output
The final report prints a threads section like this:
threads - Thread CPU and memory statistics. (RSS: 7.8 MB, Alloc: 2.1 MB, Dealloc: 304.3 KB, Diff: 1.8 MB)
+--------------+----------+-------+-------+----------+---------+-----------+----------+----------+----------+
| Thread       | Status   | CPU%  | Max%  | CPU User | CPU Sys | CPU Total | Alloc    | Dealloc  | Diff     |
+--------------+----------+-------+-------+----------+---------+-----------+----------+----------+----------+
| main         | Sleeping | 6.3%  | 6.3%  | 0.123s   | 0.070s  | 0.193s    | 367.8 KB | 9.9 KB   | 357.9 KB |
+--------------+----------+-------+-------+----------+---------+-----------+----------+----------+----------+
| worker-1     | Running  | 98.2% | 99.0% | 1.842s   | 0.031s  | 1.873s    | 12.4 KB  | 12.1 KB  | 316 B    |
+--------------+----------+-------+-------+----------+---------+-----------+----------+----------+----------+
| thread_5     | Sleeping | -     | -     | 0.000s   | 0.000s  | 0.000s    | 640 B    | 24 B     | 616 B    |
+--------------+----------+-------+-------+----------+---------+-----------+----------+----------+----------+
Two things stand out here. main is Sleeping yet its Diff is 357.9 KB and growing - allocations made on that thread are being retained, so whatever it built up is never freed. worker-1 runs at 98% CPU with almost all of it in user time - that’s the compute hotspot, and since its Diff is near zero, it’s CPU-bound rather than allocation-heavy. This kind of per-thread visibility matters most in latency-critical apps, where one saturated thread can delay everything behind it.
The live TUI shows the same data refreshing in real time:
FAQ
How do I find which thread is using the most CPU in Rust?
Sort by CPU% and check Max% for spikes that don’t show in the current sample. The User/Sys split then tells you whether the thread is computing (user) or hammering syscalls (sys). To attribute that CPU time to specific functions, use CPU profiling.
How do I detect a memory leak in a specific thread?
Run with the hotpath-alloc feature and watch the Diff column over time. A thread whose Diff grows steadily under constant load is retaining memory. Then switch to the functions view in allocation mode to find the function doing the allocating.
What do the thread states Running, Sleeping and Blocked mean?
Running is on-CPU, Sleeping is parked or waiting (normal for idle workers), and Blocked is an uninterruptible wait, typically disk I/O. Occasional Blocked is fine; a thread stuck there is a synchronous I/O bottleneck.
How do I monitor per-thread memory allocation in a Tokio app?
Enable hotpath-alloc and name your worker threads so they’re distinguishable in the table. Watch for workers that are Sleeping but keep accumulating Diff - they allocated memory during work that was never released. Pair this with Tokio runtime monitoring to see worker scheduling stats alongside memory. Many open-source projects using hotpath run exactly this setup.
Related: CPU profiling · Functions · Tokio Runtime · Configuration