Real-time Rust performance, memory and data flow profiler

Try the TUI demo via SSH - no installation required:
hotpath-rs is a simple async Rust profiler. It instruments functions, channels, futures, and streams to quickly find bottlenecks and focus optimizations where they matter most. hotpath can provide actionable insights into time, memory, and data flow with minimal setup.
You can use it to produce one-off performance (timing or memory) reports:
or use the live TUI dashboard to monitor real-time performance and data flow metrics with debug info:
Features
- Zero-cost when disabled - fully gated by a feature flag.
- Low-overhead profiling for both sync and async code.
- Live TUI dashboard - real-time monitoring of performance data flow metrics in TUI dashboard (built with ratatui.rs).
- Static reports for one-off programs - alternatively print profiling summaries without running the TUI.
- Memory allocation tracking - track bytes allocated and allocation counts per function.
- Channels, futures and streams monitoring - track messages flow and throughput.
- Detailed stats: avg, total time, call count, % of total runtime, and configurable percentiles (p95, p99, etc.).
- GitHub Actions integration - configure CI to automatically benchmark your program against a base branch for each PR
Quick demo
Other then the SSH demo an easy way to quickly try the TUI is to run it in auto-instrumentation mode. The TUI process profiles itself and displays its own performance metrics in real time.
First, install hotpath CLI with auto-instrumentation enabled:
cargo install hotpath --features='tui,hotpath,hotpath-alloc'
Then launch the console:
hotpath console
and you’ll see timing, memory and channel usage metrics.
Make sure to reinstall it without the auto-profiling features so that you can also observe metrics of other programs!
cargo install hotpath --features='tui'
Installation
Add to your Cargo.toml:
[dependencies]
hotpath = "0.9"

[features]
hotpath = ["hotpath/hotpath"]
hotpath-alloc = ["hotpath/hotpath-alloc"]
This config ensures that the lib has no compile time or runtime overhead unless explicitly enabled via a hotpath feature. All the lib dependencies are optional (i.e. not compiled) and all macros are noop unless profiling is enabled.
Learn more
See the rest of the docs to learn how to instrument and profile your program:
- Sampling Comparison - when to use
hotpathvs CPU sampling profilers - Profiling modes - static reports vs live TUI dashboard
- Functions - measure execution time and memory allocations
- Futures - monitor async code, poll counts, and resolved values
- Channels - track messages flow and throughput
- Streams - instrument async streams
- Threads - monitor threads usage
- GitHub CI integration - benchmark PRs automatically
hotpath-rs and Sampling Profilers comparison
Reading time: 8 minutes
In this section, we’ll compare hotpath with established sampling profilers such as perf, flamegraph, and samply.
We’ll walk through three common scenarios - CPU-bound code, blocking I/O, and async I/O - to show how the output of sampling profilers differs from hotpath instrumentation (in some cases, the results are completely different!).
To make sense of these differences, we’ll go beyond the profiling output itself. We’ll briefly dig into how Rust I/O works under the hood, how parked threads spend time waiting, and how the Tokio runtime schedules and wakes async tasks.
We will use sampling reports from samply. But the same fundamental behavior applies to both perf and flamegraph, as they all rely on periodic CPU sampling. You can follow the examples by cloning the project repo and installing the dependencies:
git clone [email protected]:pawurb/hotpath-rs.git
cargo install samply
CPU-bound work
Let’s start with the CPU-bound example:
#[hotpath::measure]
fn heavy_work(iterations: u32) -> u64 {
    let mut result: u64 = 1;
    for i in 0..iterations {
        result = result.wrapping_mul(black_box(i as u64).wrapping_add(7));
        result ^= result >> 3;
    }
    result
}

#[hotpath::measure]
fn light_work(iterations: u32) -> u64 {
    let mut result: u64 = 0;
    for i in 0..iterations {
        result = result.wrapping_add(black_box(i as u64));
    }
    result
}

#[hotpath::main]
fn main() {
    let mut total: u64 = 0;

    for _ in 0..1000 {
        total = total.wrapping_add(heavy_work(500_000));
        total = total.wrapping_add(light_work(100_000));
    }
}
This program runs two CPU-bound functions in a tight loop: one intentionally expensive (heavy_work) and one relatively cheap (light_work).
Running it with --features=hotpath produces the following report:
cargo run --example profile_cpu --features hotpath --profile profiling
[hotpath] timing - Execution duration of functions.
profile_cpu::main: 210.02ms
+-------------------------+-------+-----------+-----------+-----------+---------+
| Function                | Calls | Avg       | P95       | Total     | % Total |
+-------------------------+-------+-----------+-----------+-----------+---------+
| profile_cpu::main       | 1     | 209.92 ms | 209.98 ms | 209.92 ms | 100.00% |
+-------------------------+-------+-----------+-----------+-----------+---------+
| profile_cpu::heavy_work | 1000  | 169.91 µs | 254.72 µs | 169.91 ms | 80.94%  |
+-------------------------+-------+-----------+-----------+-----------+---------+
| profile_cpu::light_work | 1000  | 38.21 µs  | 51.26 µs  | 38.21 ms  | 18.20%  |
+-------------------------+-------+-----------+-----------+-----------+---------+
Let’s compare it to the samply report:
cargo build --example profile_cpu --profile profiling
samply record ./target/profiling/examples/profile_cpu
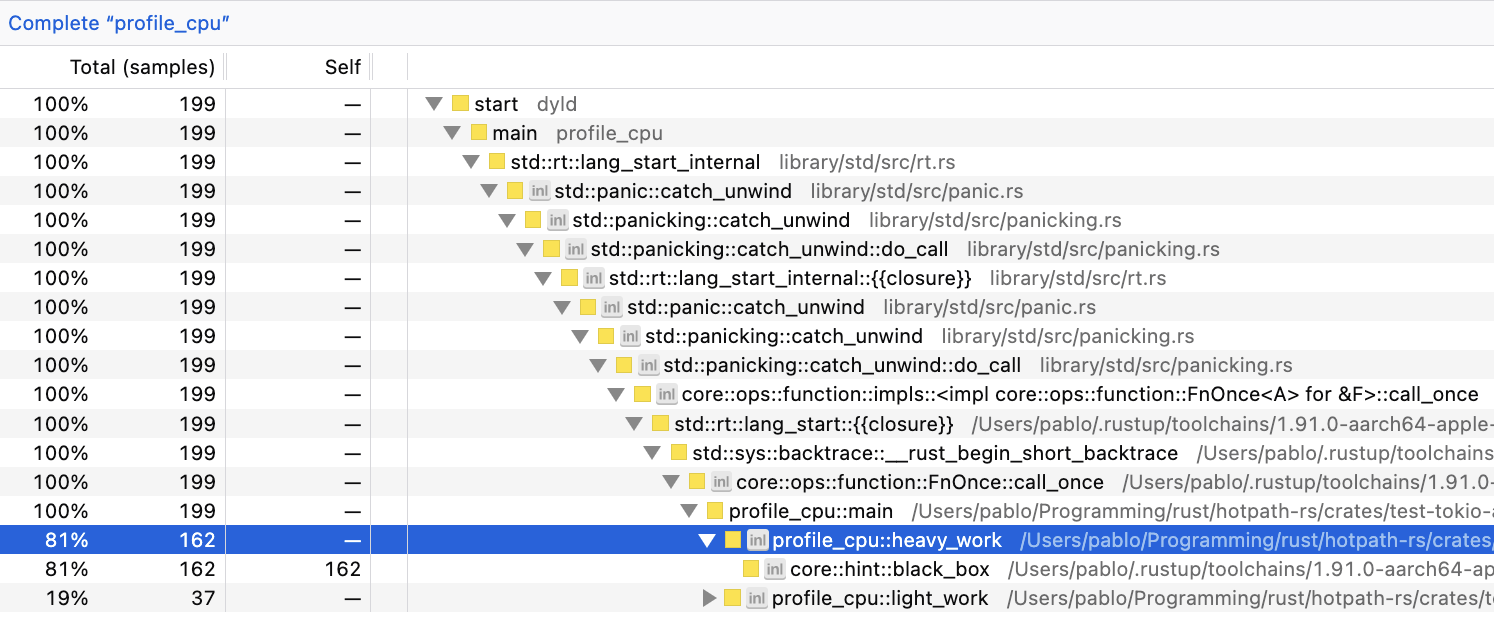
We can see that both profile_cpu::heavy_work and profile_cpu::light_work have similar ratios of total processing/CPU time regardless of the measurement method. Minor differences are expected from normal execution variability.
For statistically significant performance benchmarks, criterion.rs is usually a great choice. criterion excels at answering "is this faster?", whereas hotpath can help you answer the question of "why is my system slow?".
Blocking I/O
Let’s now analyze the blocking IO-bound example:
examples/profile_blocking_io.rs
const FILE_SIZE: usize = 10 * 1024 * 1024; // 10 MB
const CHUNK_SIZE: usize = 8 * 1024; // 8 KB

#[hotpath::measure]
fn create_test_file(path: &str) {
    let mut file = File::create(path).expect("create");
    let buf = vec![0xABu8; CHUNK_SIZE];

    for _ in 0..(FILE_SIZE / CHUNK_SIZE) {
        file.write_all(&buf).expect("write");
    }

    file.sync_all().expect("sync");
}

#[hotpath::measure]
fn read_file(path: &str) -> Vec<u8> {
    let file = File::open(path).expect("open");
    let mut reader = BufReader::with_capacity(CHUNK_SIZE, file);
    let mut data = Vec::with_capacity(FILE_SIZE);
    reader.read_to_end(&mut data).expect("read");
    data
}

#[hotpath::main]
fn main() {
    let path = "/tmp/hotpath_blocking.bin";
    create_test_file(path);

    for _ in 0..5 {
        let _data = read_file(path);
    }

    let _ = std::fs::remove_file(path);
}
The program writes a 10 MB file to disk in 8 KB chunks, then reads the entire file into memory a few times using blocking I/O.
Profiling it with hotpath produces this report:
cargo run --example profile_blocking_io --features hotpath --profile profiling
profile_blocking_io::main: 18.23ms
+---------------------------------------+-------+-----------+----------+----------+---------+
| Function                              | Calls | Avg       | P95      | Total    | % Total |
+---------------------------------------+-------+-----------+----------+----------+---------+
| profile_blocking_io::main             | 1     | 18.10 ms  | 18.10 ms | 18.10 ms | 100.00% |
+---------------------------------------+-------+-----------+----------+----------+---------+
| profile_blocking_io::create_test_file | 1     | 12.99 ms  | 12.99 ms | 12.99 ms | 71.77%  |
+---------------------------------------+-------+-----------+----------+----------+---------+
| profile_blocking_io::read_file        | 5     | 956.59 µs | 1.26 ms  | 4.78 ms  | 26.42%  |
+---------------------------------------+-------+-----------+----------+----------+---------+
and with samply:
cargo build --example profile_blocking_io --profile profiling
samply record ./target/profiling/examples/profile_blocking_io
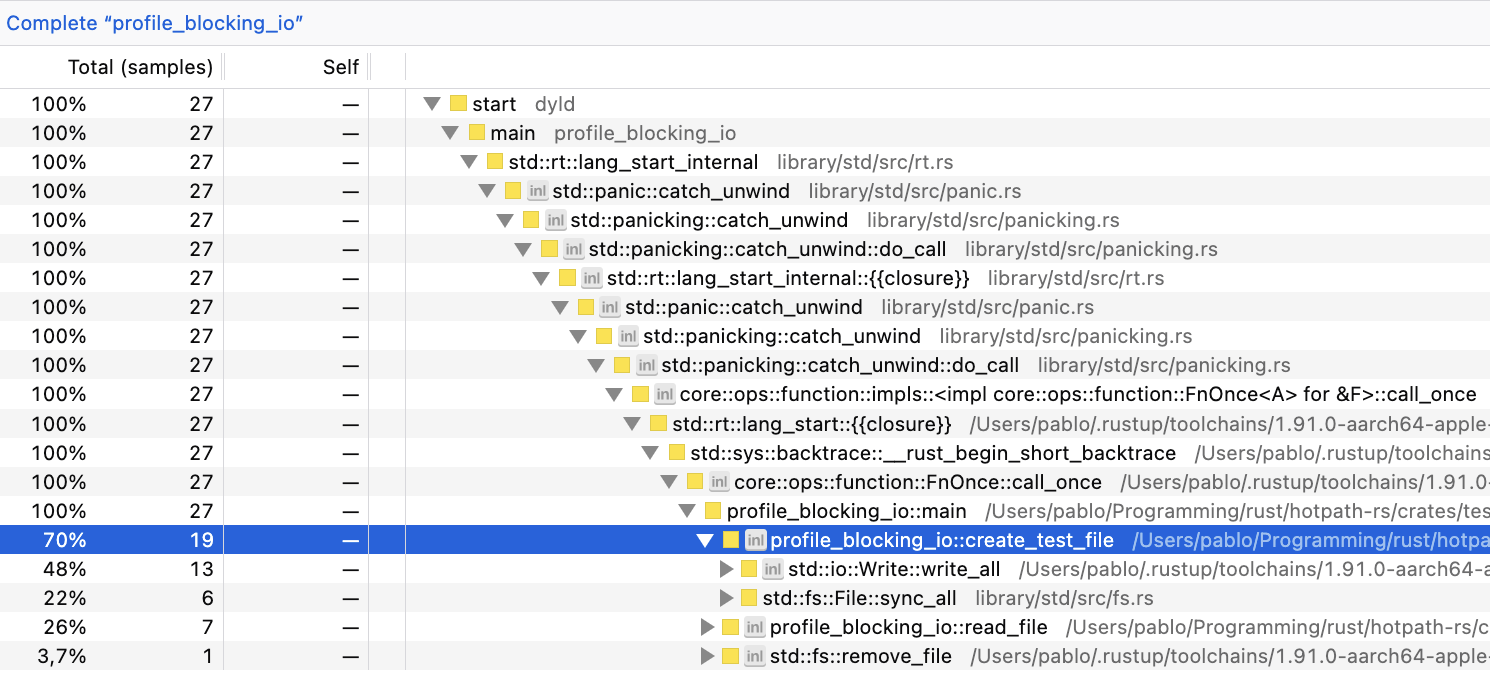
In this example, there’s more variation than in the CPU-bound one. But profile_blocking_io::create_test_file usually takes 67%-75% and profile_blocking_io::read_file 21%-29%.
So far, both profilers output comparable numbers. So what’s the point of using hotpath, while it requires manual instrumentation?
Let’s move on to the last example.
Async I/O
const FILE_SIZE: usize = 20 * 1024 * 1024; // 20 MB
const CHUNK_SIZE: usize = 8 * 1024; // 8 KB
const NUM_FILES: usize = 5;

#[hotpath::measure]
async fn create_file(path: &str) {
    let mut file = File::create(path).await.expect("create");
    let buf = vec![0xABu8; CHUNK_SIZE];
    for _ in 0..(FILE_SIZE / CHUNK_SIZE) {
        file.write_all(&buf).await.expect("write");
    }
    file.sync_all().await.expect("sync");
}

#[hotpath::measure]
async fn read_file(path: &str) -> Vec<u8> {
    let file = File::open(path).await.expect("open");
    let mut reader = tokio::io::BufReader::new(file);
    let mut data = Vec::with_capacity(FILE_SIZE);
    reader.read_to_end(&mut data).await.expect("read");
    data
}

#[tokio::main(flavor = "current_thread")]
#[hotpath::main]
async fn main() {
    let paths: Vec<String> = (0..NUM_FILES)
        .map(|i| format!("/tmp/hotpath_async_{i}.bin"))
        .collect();
    let path_refs: Vec<&str> = paths.iter().map(|s| s.as_str()).collect();

    let futures: Vec<_> = path_refs.iter().map(|p| create_file(p)).collect();
    join_all(futures).await;

    let futures: Vec<_> = path_refs.iter().map(|p| read_file(p)).collect();
    join_all(futures).await;

    for path in &paths {
        tokio::fs::remove_file(path).await.ok();
    }
}
This program concurrently creates a few 20 MB files using async Tokio I/O, writing them in 8 KB chunks, then concurrently reads all files back into memory. It runs on a single-threaded flavor = "current_thread" Tokio runtime, leveraging async I/O APIs from tokio::fs and tokio::io.
Let’s profile it with hotpath:
cargo run --example profile_async_io --features hotpath --profile profiling
profile_async_io::main: 166.70ms
+-------------------------------+-------+-----------+-----------+-----------+---------+
| Function                      | Calls | Avg       | P95       | Total     | % Total |
+-------------------------------+-------+-----------+-----------+-----------+---------+
| profile_async_io::create_file | 5     | 137.05 ms | 150.60 ms | 685.26 ms | 411.65% |
+-------------------------------+-------+-----------+-----------+-----------+---------+
| profile_async_io::main        | 1     | 166.46 ms | 166.59 ms | 166.46 ms | 100.00% |
+-------------------------------+-------+-----------+-----------+-----------+---------+
| profile_async_io::read_file   | 5     | 11.70 ms  | 11.80 ms  | 58.51 ms  | 35.14%  |
+-------------------------------+-------+-----------+-----------+-----------+---------+
Things just got interesting! Apparently, profile_async_io::create_file accounted for >400% of the total processing time. We will explain it in a moment.
Let’s compare it to the samply report:
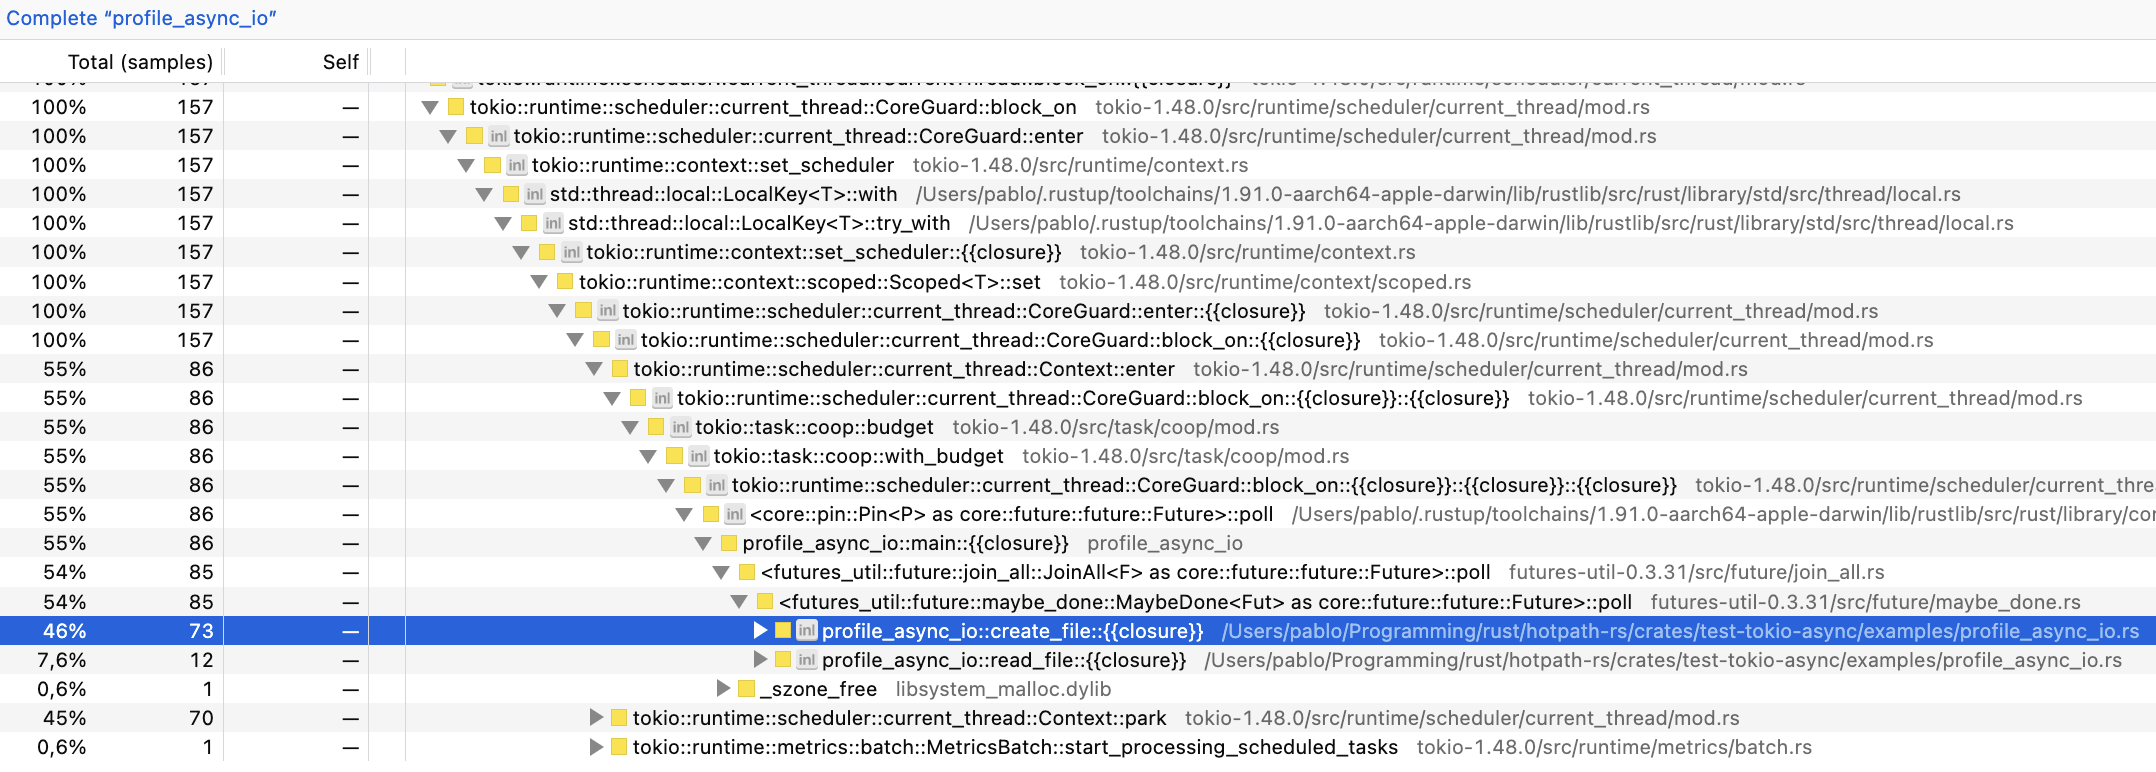
samply output is now significantly more verbose because of the Tokio runtime calls. And we can see that perf numbers are completely different from hotpath!
+-------------------------------+-----------+-----------+
| Function                      | hotpath   |  samply   |
+-------------------------------+-----------+-----------+
| profile_async_io::create_file | ~410%     | ~45%      |
| profile_async_io::read_file   | ~35%      | ~8%       |
+-------------------------------+-----------+-----------+
What’s going on?
Neither of these outputs is wrong; they just measure completely different things. To explain it, we will need to dive deeper into how Rust’s async runtime works.
BTW, it was supposed to be a quick docs entry that eventually evolved into a full-blown blog post. But I hope you’re still with me.
Sampling vs guards
Sampling profilers, like samply monitor a running program by periodically interrupting it and recording what it is doing at that instant. In an async runtime like Tokio, a sampling profiler can produce misleading-looking results, not because it’s wrong, but because it samples executor mechanics, not logical async work.
hotpath, on the other hand, works by instantiating guard objects with an internal timer for each instrumented method. When the method completes execution, measured timing (or memory usage) is reported using a custom guard Drop trait implementation.
It means that, unlike sampling profilers, hotpath calculates the exact time each async method took to execute, including the time spent sleeping while waiting for async I/O to complete.
hotpath measured profile_async_io::create taking over 400% of execution time, because it includes all the waiting time. That’s the core of Rust’s async I/O: multiple futures can await at the same time, effectively parallelizing work. BTW, check out hotpath::future! macro to get detailed insights into Rust futures lifecycle.
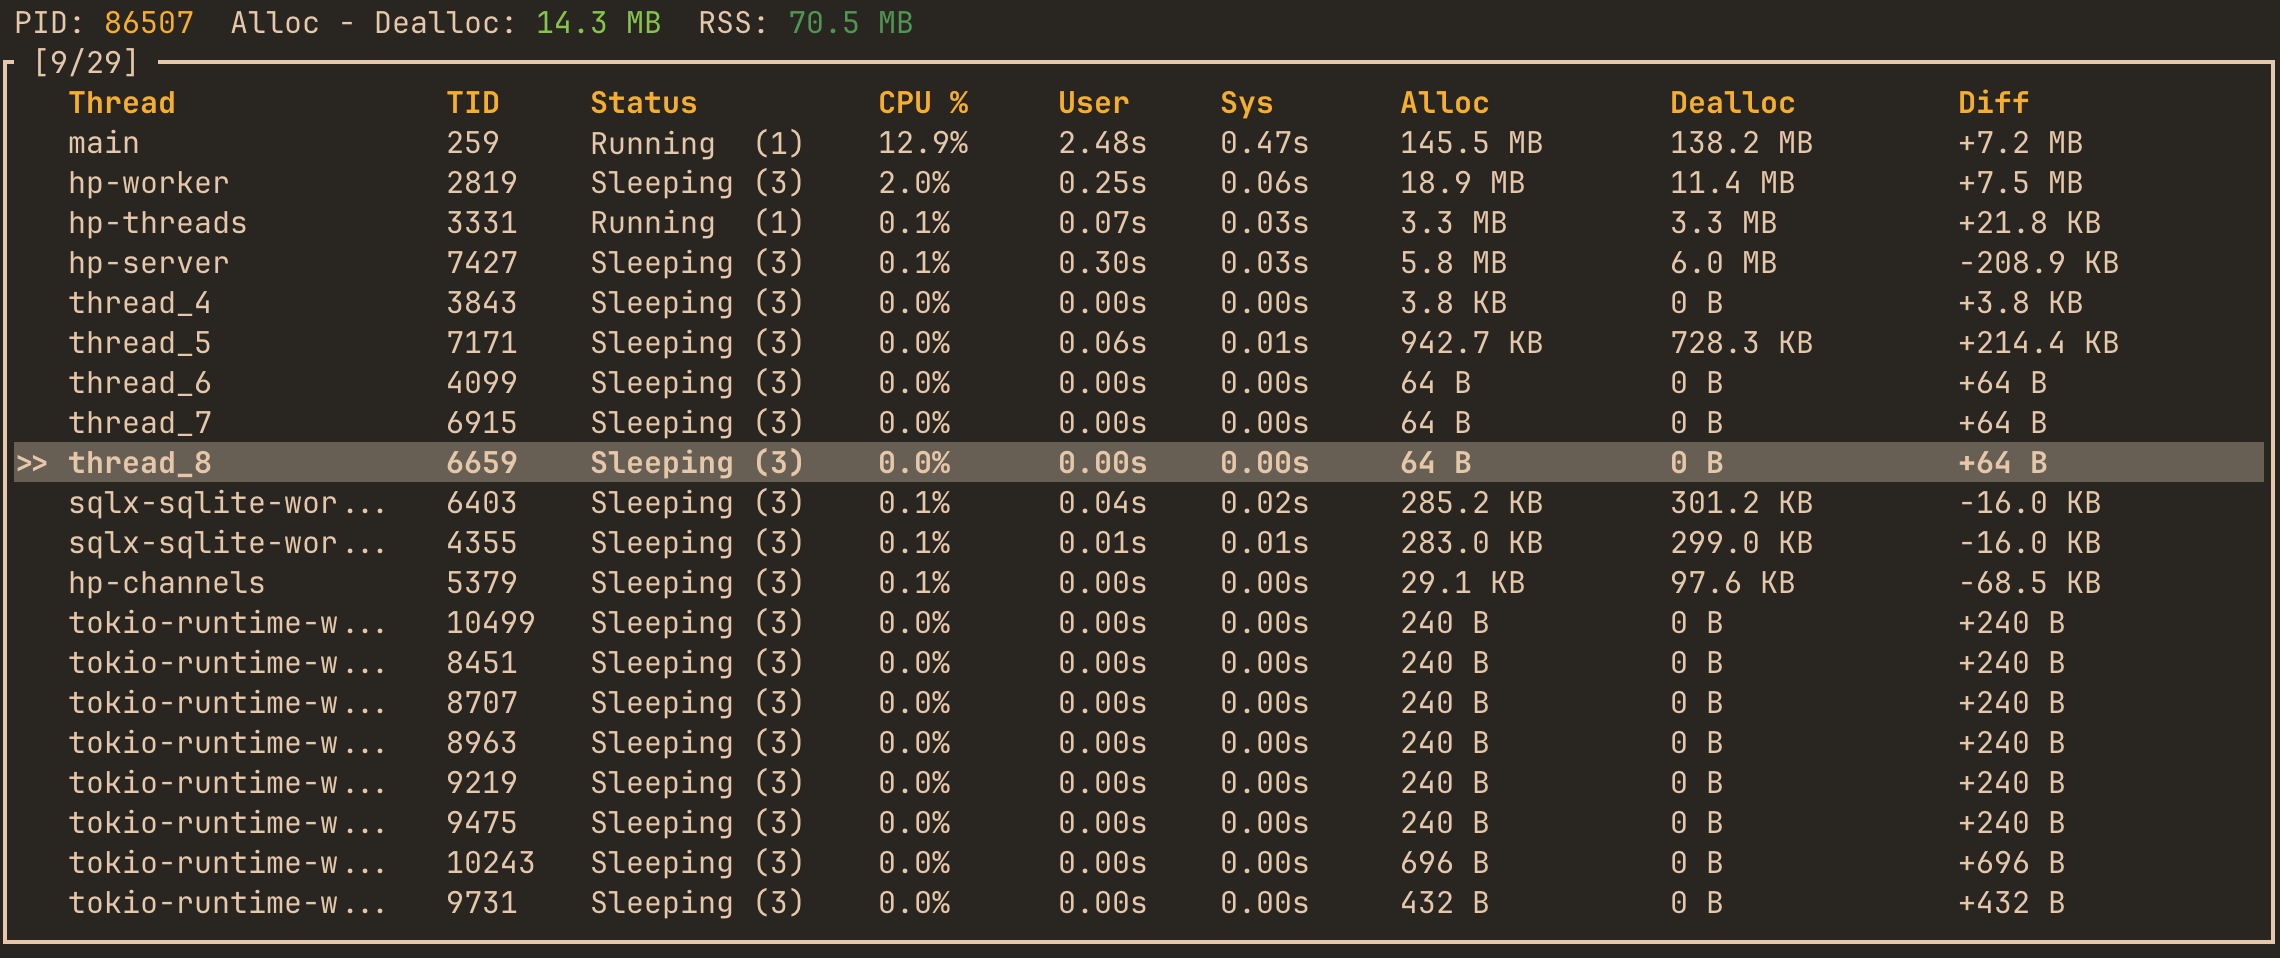
hotpath’s threads monitoring feature lets us peek under the hood at how Tokio implements async I/O. Apparently, despite running in a current_thread mode, Tokio still spawns multiple worker threads. To confirm it, you can run a profile_async_io_long.rs example, and check its thread usage with the hotpath console TUI:
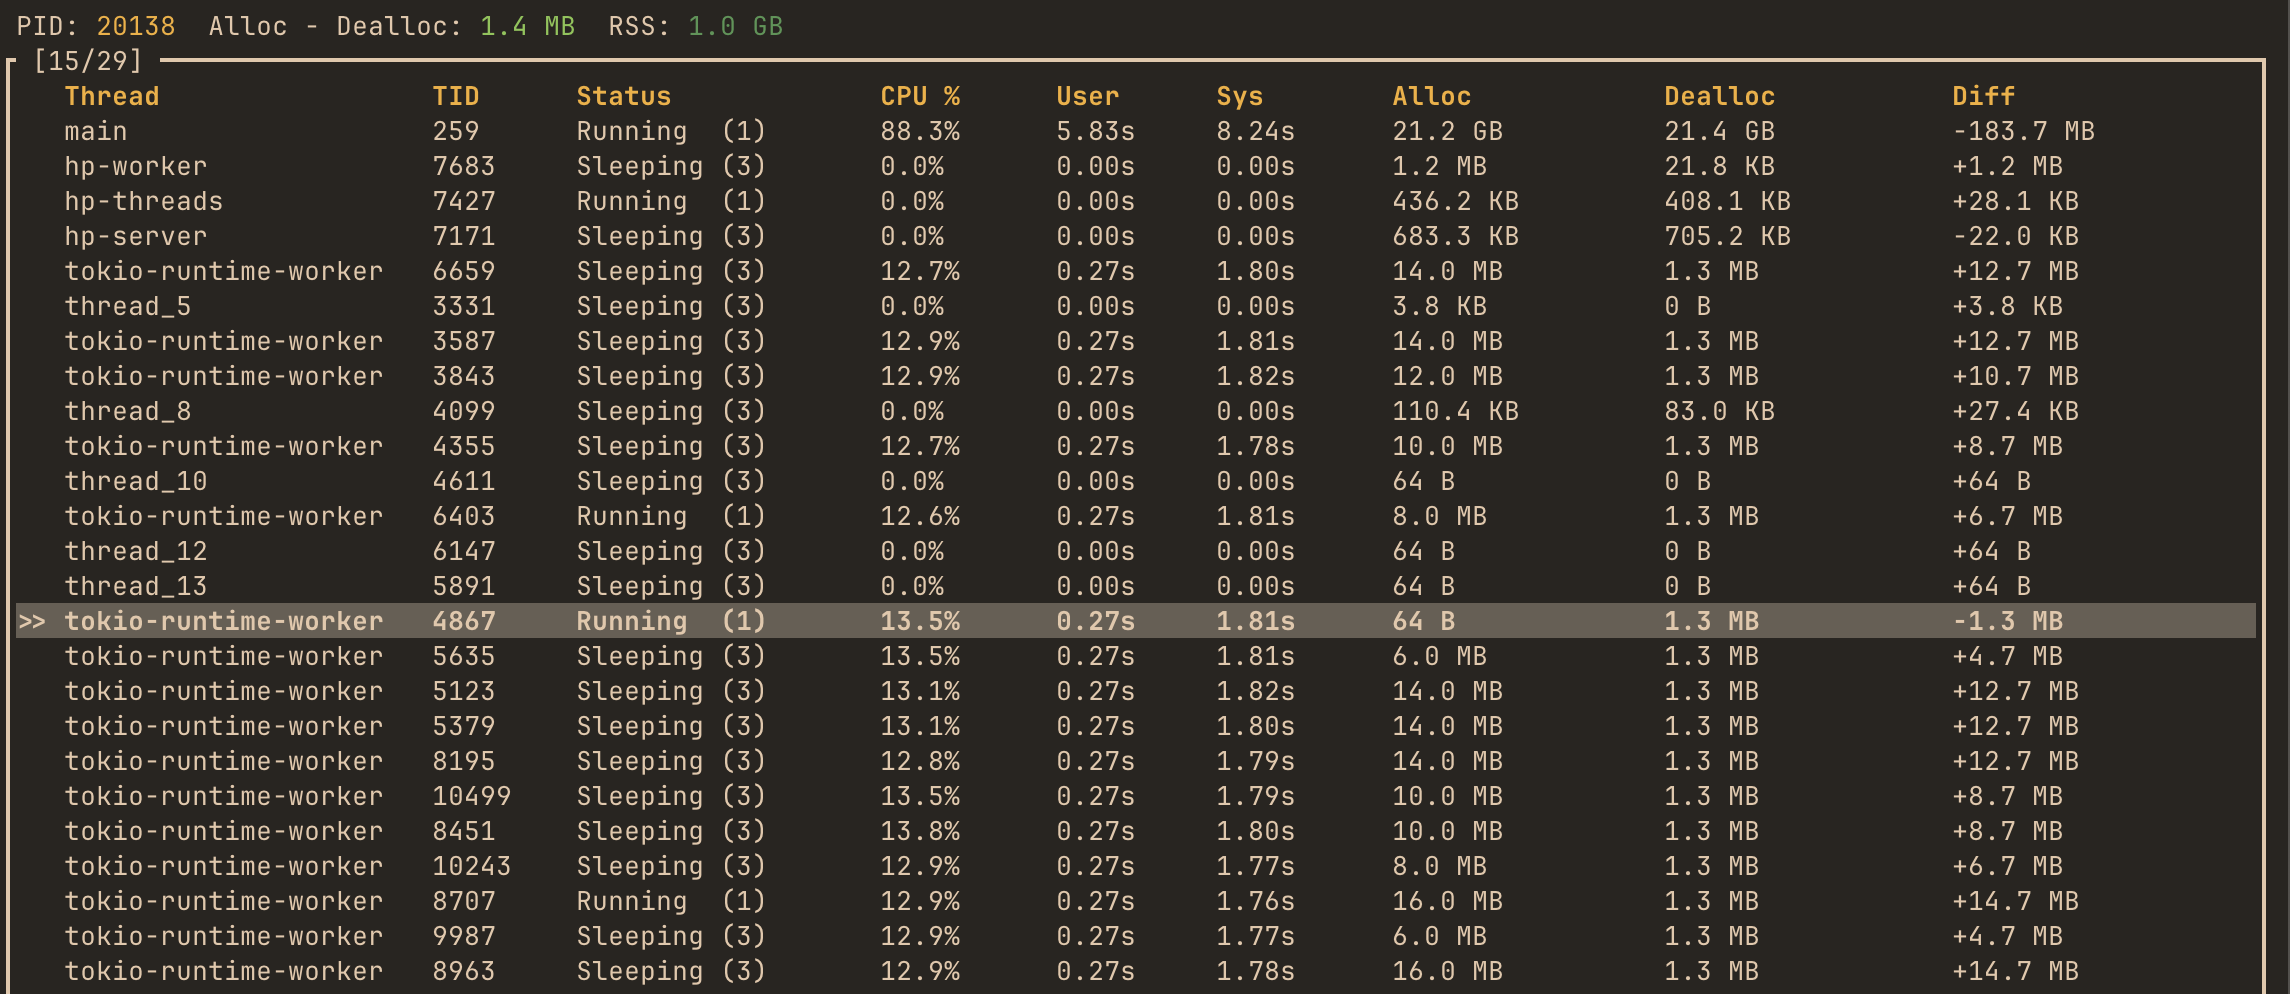
It shows multiple tokio-runtime-worker threads somewhat busy (~13% CPU), toggling between running and sleeping states. I don’t have much exp with Tokio internals. But based on my research, Tokio can use separate threads, parking them while waiting for blocking system I/O calls to complete. That’s why profile_async_io::create took over 400% of the total run time in a supposedly single-threaded context.
Summary
Sampling profilers and hotpath measure fundamentally different aspects of program behavior. Tools like perf, flamegraph, or samply excel at answering "where is CPU time spent?" by observing which threads are executing at a given moment. It makes them ideal for CPU-bound workloads. However, they largely ignore wall-clock time spent waiting on I/O, locks, or async awaits - because nothing is running on the CPU during those periods.
hotpath takes a different approach: it measures logical execution time of instrumented functions, including time spent awaiting async I/O or being parked by the runtime. This makes it particularly effective for understanding real application behavior in I/O-heavy and async systems, where the dominant cost is often waiting rather than computation. In our examples we used file reads and writes to simulate I/O, but the same behavior applies to operations such as HTTP requests, SQL database queries, or RPC calls.
In practice, the two approaches complement each other. Use sampling profilers to optimize hot CPU paths and runtime internals; use hotpath to understand end-to-end latency and "why the system feels slow?" from the user’s point of view. For most non-trivial Rust systems, you’ll get the clearest picture by using both.
In the following sections, you’ll learn how to instrument the key parts of your program - functions, channels, streams, and more - to gain clear, actionable insight into its behavior.
- Profiling modes - static reports vs live TUI dashboard
- Functions - measure execution time and memory allocations
- Futures - monitor async code, poll counts, and resolved values
- Channels - track messages flow and throughput
- Streams - instrument async streams
- Threads - monitor threads usage
- GitHub CI integration - benchmark PRs automatically
Profiling modes
hotpath supports two complementary approaches to performance monitoring.
Static reports
Best for CLI tools, tests, or short-lived applications. On exit, hotpath prints a summary of execution time, memory usage, and timing percentiles. Reports can be rendered as readable tables or exported as JSON for automated analysis.
Every instrumented program prints a performance report automatically when executed with the hotpath feature enabled.
cargo run --features=hotpath
Use --features='hotpath,hotpath-alloc' to print memory usage report:
cargo run --features='hotpath,hotpath-alloc'
Enable JSON output by setting HOTPATH_JSON=true.
Live TUI dashboard
Best for long-running processes like HTTP servers, or background workers. It continuously displays functions performance, allocation counters, and channel/stream throughput while the application is running. This mode helps diagnose runtime bottlenecks, queue buildup, and data flow issues that are not visible in static summaries.
Install the TUI with:
cargo install hotpath --features=tui
Run the dashboard:
hotpath console
Then launch your instrumented application (with hotpath feature enabled) in a separate terminal to see live performance metrics.
You can learn how to instrument any Rust program in the next sections.
Functions profiling
To start profiling functions you’ll only need #[hotpath::main] and #[hotpath::measure] macros:
#[hotpath::measure]
fn sync_function(sleep: u64) {
    std::thread::sleep(Duration::from_nanos(sleep));
}

#[hotpath::measure]
async fn async_function(sleep: u64) {
    tokio::time::sleep(Duration::from_nanos(sleep)).await;
}

// When using with tokio, place the #[tokio::main] first
#[tokio::main]
#[hotpath::main]
async fn main() {
    for i in 0..100 {
        // Measured functions will automatically send metrics
        sync_function(i);
        async_function(i * 2).await;

        // Measure code blocks with static labels
        hotpath::measure_block!("custom_block", {
            std::thread::sleep(Duration::from_nanos(i * 3))
        });
    }
}
When the hotpath feature is disabled, all macros are noop and have zero compile or runtime overhead.
Run your program with a hotpath feature:
cargo run --features=hotpath
Output:
[hotpath] Performance summary from basic::main (Total time: 122.13ms):
+-----------------------+-------+---------+---------+----------+---------+
| Function              | Calls | Avg     | P99     | Total    | % Total |
+-----------------------+-------+---------+---------+----------+---------+
| basic::async_function | 100   | 1.16ms  | 1.20ms  | 116.03ms | 95.01%  |
+-----------------------+-------+---------+---------+----------+---------+
| custom_block          | 100   | 17.09µs | 39.55µs | 1.71ms   | 1.40%   |
+-----------------------+-------+---------+---------+----------+---------+
| basic::sync_function  | 100   | 16.99µs | 35.42µs | 1.70ms   | 1.39%   |
+-----------------------+-------+---------+---------+----------+---------+
#[hotpath::main] macro
Attribute macro that initializes the background measurement processing when applied. Supports parameters:
percentiles = [50, 95, 99]- Custom percentiles to display (defaults to[95])format = "json"- Output format"table","json","json-pretty", (defaults totable)limit = 20- Maximum number of functions to display (default:15,0= show all)timeout = 5000- Optional timeout in milliseconds. If specified, the program will print the report and exit after the timeout. Useful for profiling long-running programs like HTTP servers, if you don’t want to use live monitoring TUI dashboard.
#[hotpath::measure] macro
An attribute macro that instruments functions to send timing/memory measurements to the background processor. Parameters:
log = true- logs the result value when the function returns (requiresstd::fmt::Debugon return type)
Example:
#[hotpath::measure(log = true)]
fn compute() -> i32 {
    // The result value will be logged in TUI console
    42
}
#[hotpath::measure_all] macro
An attribute macro that applies #[measure] to all functions in a mod or impl block. Useful for bulk instrumentation without annotating each function individually. Can be used on:
- Inline module declarations - Instruments all functions within the module
- Impl blocks - Instruments all methods in the implementation
Example:
// Measure all methods in an impl block
#[hotpath::measure_all]
impl Calculator {
    fn add(&self, a: u64, b: u64) -> u64 { a + b }
    fn multiply(&self, a: u64, b: u64) -> u64 { a * b }
    async fn async_compute(&self) -> u64 { /* ... */ }
}

// Measure all functions in a module
#[hotpath::measure_all]
mod math_operations {
    pub fn complex_calculation(x: f64) -> f64 { /* ... */ }
    pub async fn fetch_data() -> Vec<u8> { /* ... */ }
}
Note: Once Rust stabilizes
#![feature(proc_macro_hygiene)]and#![feature(custom_inner_attributes)], it will be possible to use#![measure_all]as an inner attribute directly inside module files (e.g., at the top ofmath_operations.rs) to automatically instrument all functions in that module.
#[hotpath::skip] macro
A marker attribute that excludes specific functions from instrumentation when used within a module or impl block annotated with #[measure_all]. The function executes normally but doesn’t send measurements to the profiling system.
Example:
#[hotpath::measure_all]
mod operations {
    pub fn important_function() { /* ... */ } // Measured

    #[hotpath::skip]
    pub fn not_so_important_function() { /* ... */ } // NOT measured
}
hotpath::measure_block! macro
Macro that measures the execution time of a code block with a static string label.
#[hotpath::main]
fn main() {
    for i in 0..100 {
        // Measure code blocks with static labels
        hotpath::measure_block!("custom_block", {
            std::thread::sleep(Duration::from_nanos(i * 3))
        });
    }
}
If hotpath feature is disabled, the code inside block will still execute.
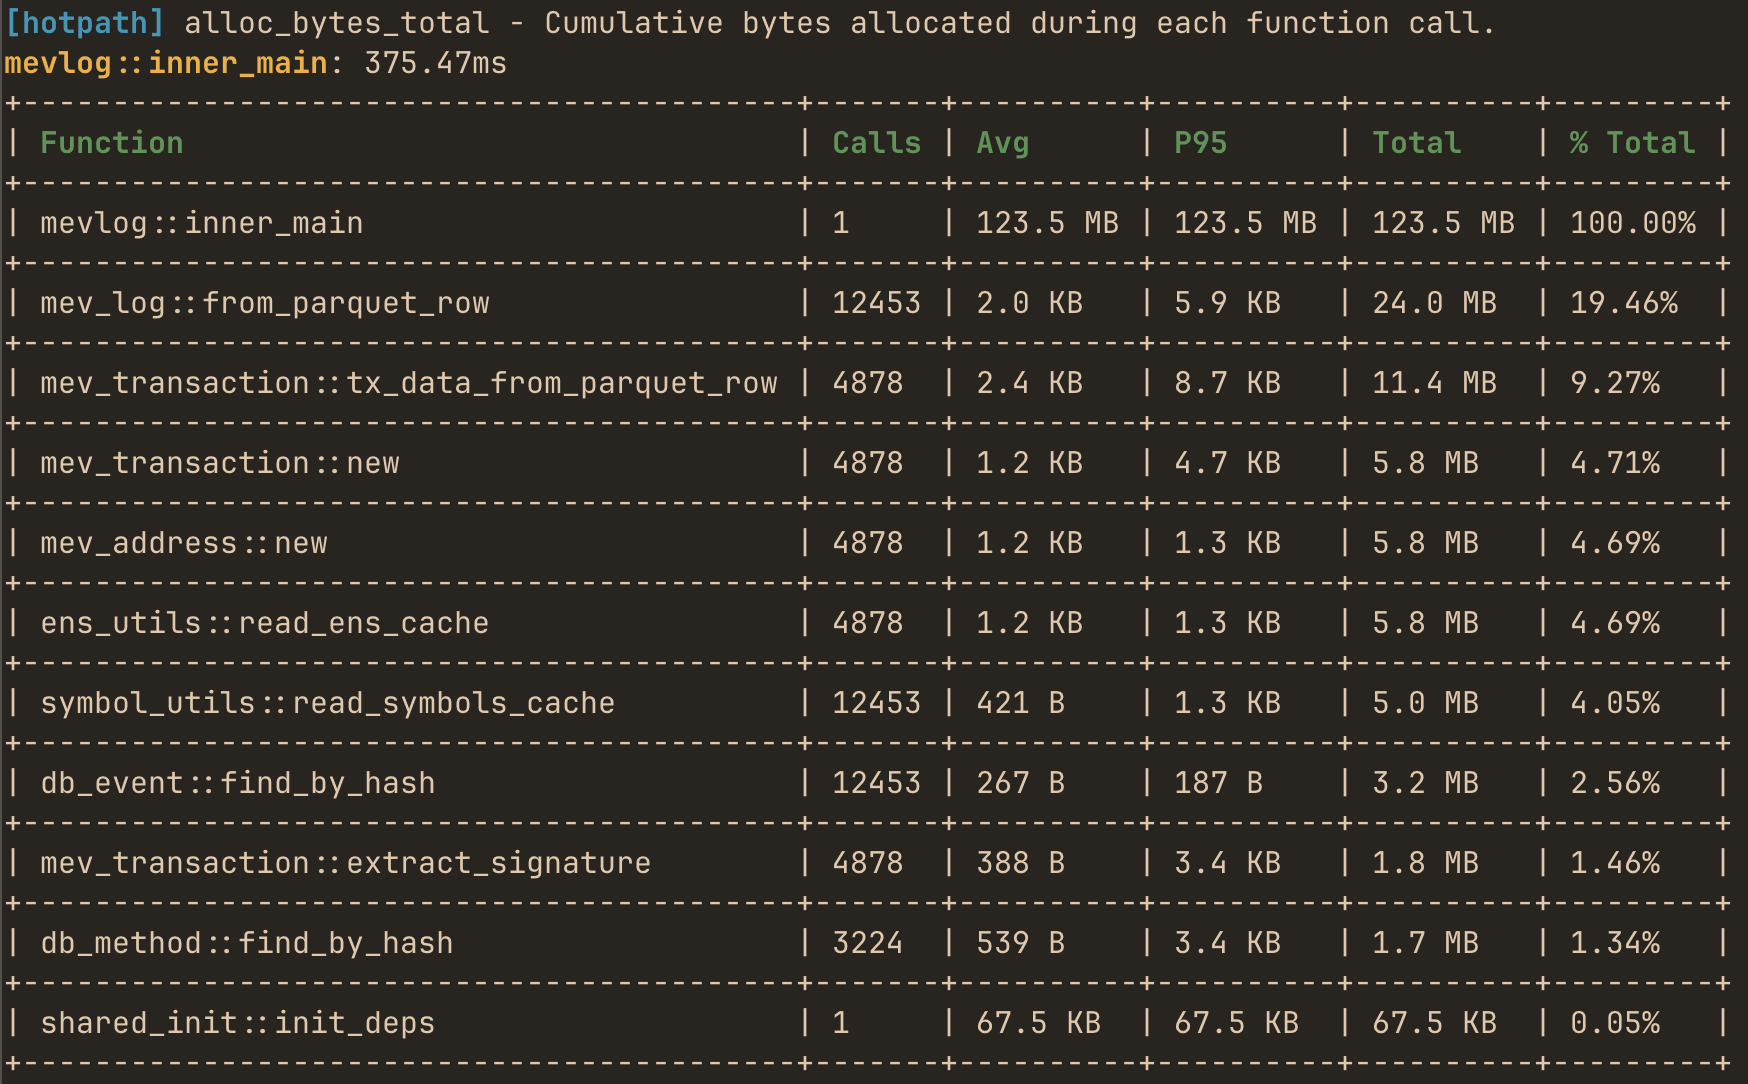
Memory and allocations profiling
In addition to time-based profiling, hotpath can track memory allocations. This feature uses a custom global allocator from allocation-counter crate to intercept all memory allocations and provides detailed statistics about memory usage per function.
Run your program with the allocation tracking feature to print a similar report:
cargo run --features='hotpath,hotpath-alloc'
Async support
To profile memory usage of async functions you have to use a similar config:
#[cfg(feature = "hotpath-alloc")]
#[tokio::main(flavor = "current_thread")]
async fn main() {
    _ = inner_main().await;
}

#[cfg(not(feature = "hotpath-alloc"))]
#[tokio::main]
async fn main() {
    _ = inner_main().await;
}

#[hotpath::main]
async fn inner_main() {
    // ...
}
It ensures that tokio runs in a current_thread runtime mode if the allocation profiling feature is enabled.
Why this limitation exists: The allocation tracking uses thread-local storage to track memory usage. In multi-threaded runtimes, async tasks can migrate between threads, making it impossible to accurately attribute allocations to specific function calls.
Memory profiling modes
By default, allocation tracking is cumulative, meaning that a function’s allocation count includes all allocations made by functions it calls (nested calls). Notably, it produces invalid results for recursive functions. To track only exclusive allocations (direct allocations made by each function, excluding nested calls), set the HOTPATH_ALLOC_SELF=true environment variable when running your program.
Nightly features
When Rust stabilizes #![feature(proc_macro_hygiene)] and #![feature(custom_inner_attributes)], it will be possible to use #![measure_all] as an inner attribute directly inside module files (e.g., at the top of math_operations.rs) to automatically instrument all functions in that module.
Futures monitoring
The future! macro and #[future_fn] attribute instrument any async function or piece of code or to track poll counts and future lifecycle:
#[tokio::main]
#[hotpath::main]
async fn main() {
// Instrument a future expression
let result = hotpath::future!(async { 42 }, log = true).await;
instrumented_fetch().await;
}
// Or use the attribute on async functions
#[hotpath::future_fn(log = true)]
async fn instrumented_fetch() -> Vec<u8> {
vec![1, 2, 3]
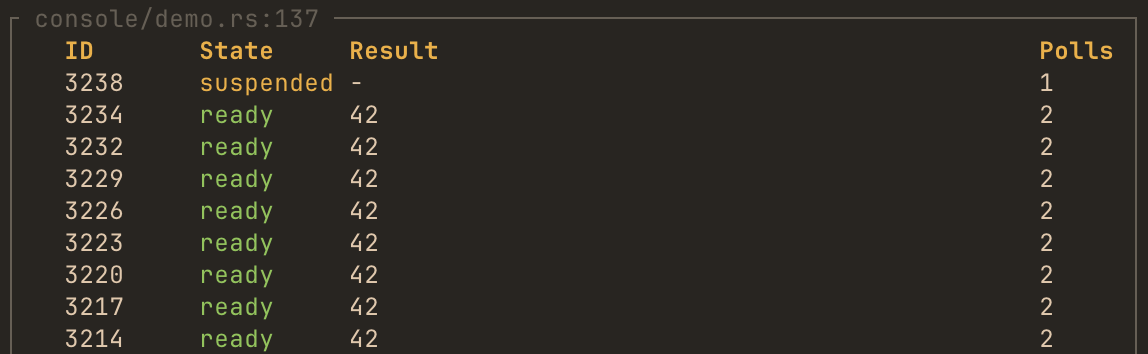
}By passing log = true TUI will display values that future resolved to:
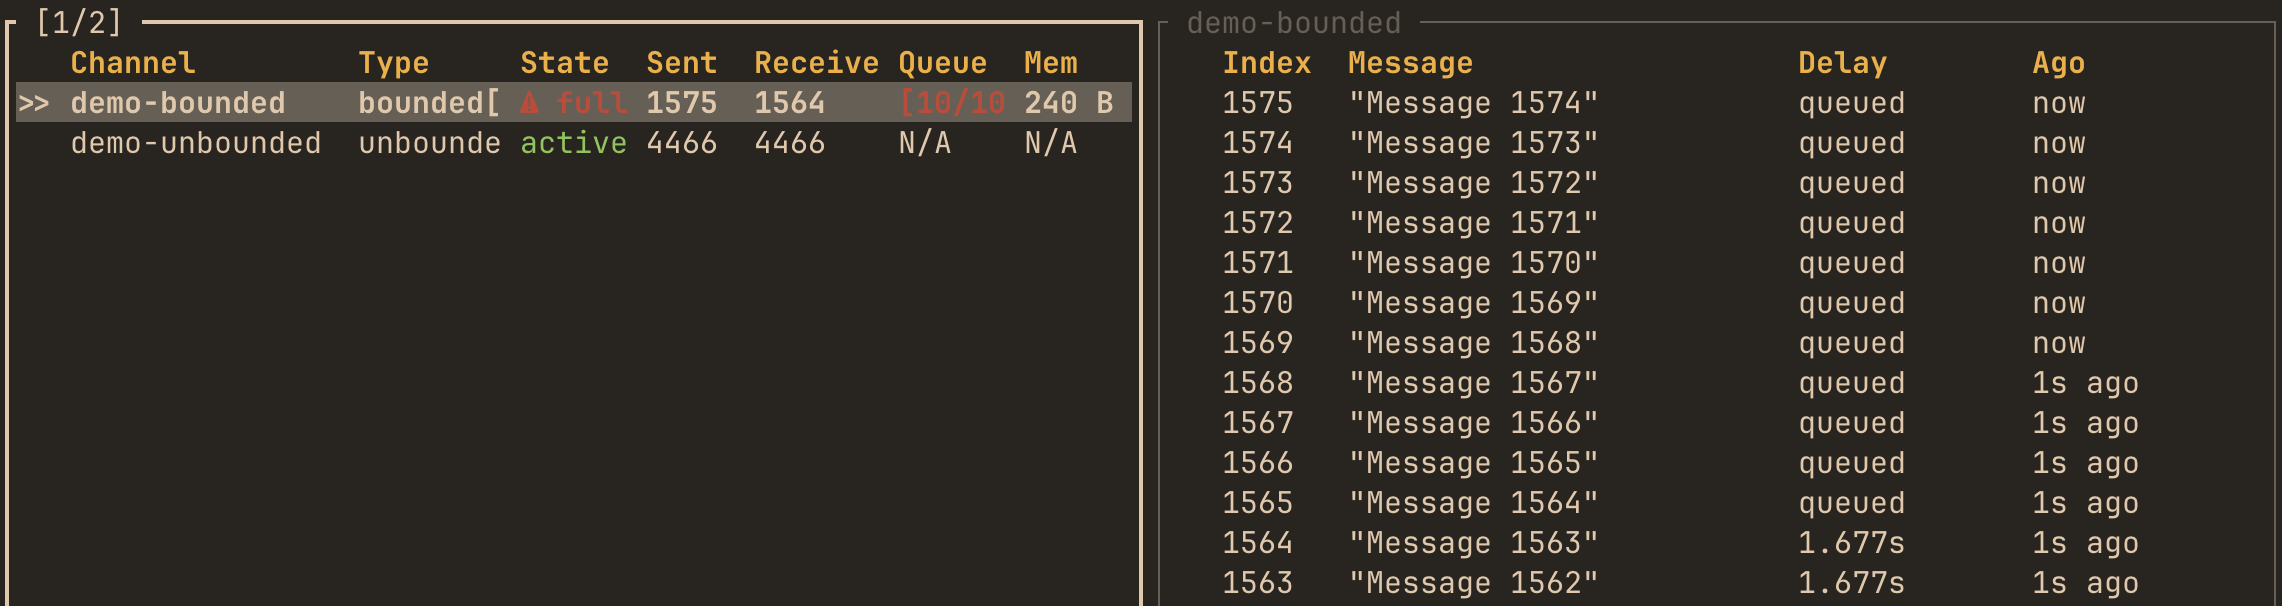
Channels monitoring
hotpath::channel! macro
This macro wraps channel creation to automatically track usage statistics and data flow:
use tokio::sync::mpsc;

#[tokio::main]
#[hotpath::main]
async fn main() {
    // Create and instrument a channel in one step
    let (tx, mut rx) = hotpath::channel!(mpsc::channel::<String>(100));

    // Use the channel exactly as before
    tx.send("Hello".to_string()).await.unwrap();
    let msg = rx.recv().await.unwrap();
}
std::sync channels can be instrumented by default. Enable tokio, futures, or crossbeam features for Tokio, futures-rs, and crossbeam channels, respectively.
Supported channel types:
tokio::sync::mpsc::channeltokio::sync::mpsc::unbounded_channeltokio::sync::oneshot::channelfutures_channel::mpsc::channelfutures_channel::mpsc::unboundedfutures_channel::oneshot::channelcrossbeam_channel::boundedcrossbeam_channel::unbounded
Optional config
// Custom label for easier identification in TUI
let (tx, rx) = hotpath::channel!(mpsc::channel::<String>(100), label = "worker_queue");

// Enable message logging (requires std::fmt::Debug trait on message type)
let (tx, rx) = hotpath::channel!(mpsc::channel::<String>(100), log = true);
Label channels to display them on top of the list. By passing log = true TUI will display messages that a channel received.
Capacity parameter requirement
For futures::channel::mpsc bounded channels, you must specify the capacity parameter because their API doesn’t expose the capacity after creation:
use futures_channel::mpsc;

// futures bounded channel - MUST specify capacity
let (tx, rx) = hotpath::channel!(mpsc::channel::<String>(10), capacity = 10);
Tokio and crossbeam channels don’t require this parameter because their capacity is accessible from the channel handles.
A note on accuracy
hotpath instruments channels by using a proxy on the receive side with the capacity of 1. Messages flow directly into your original channel, then through a proxy before reaching the consumer. This design adds 1 slot of extra buffering for bounded channels.
Please note that enabling monitoring can subtly affect channel behavior in some cases. For example, using try_send may behave slightly differently since the proxy adds 1 slot of extra capacity. Also some wrappers currently not propagate info about receiver getting dropped.
I’m actively improving the library, so any feedback, issues, bug reports are appreciated.
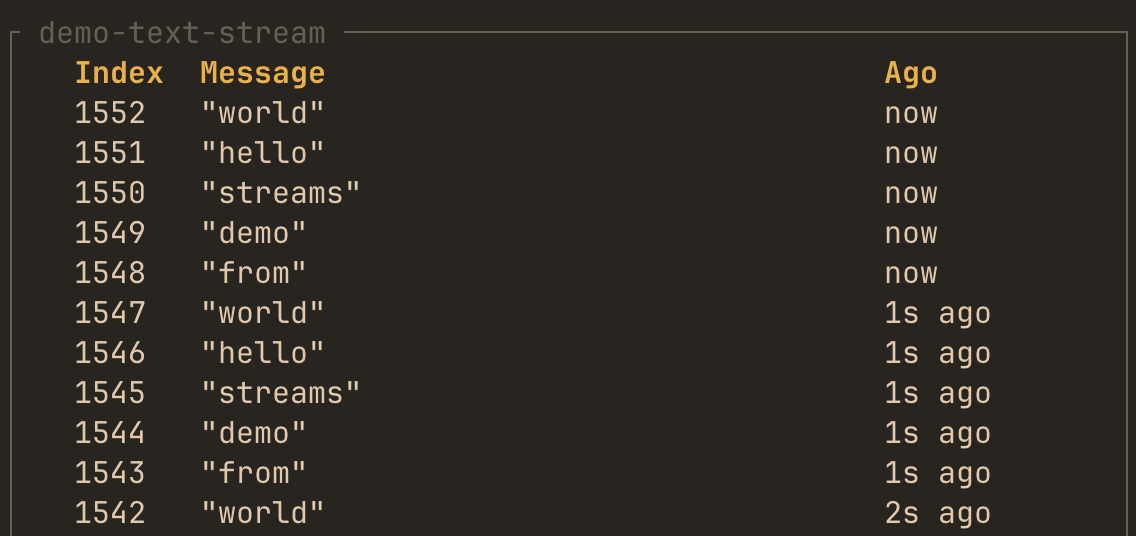
Streams monitoring
hotpath::stream! macro
This macro instruments async streams to track items yielded:
use futures::stream::{self, StreamExt};

#[tokio::main]
#[hotpath::main]
async fn main() {
    // Create and instrument a stream in one step
    let s = hotpath::stream!(stream::iter(1..=100));

    // Use it normally
    let items: Vec<_> = s.collect().await;
}
Optional config
// Custom label
let s = hotpath::stream!(stream::iter(1..=100), label = "data_stream");

// Enable item logging (requires std::fmt::Debug trait on item type)
let s = hotpath::stream!(stream::iter(1..=100), log = true);
Label streams to display them on top of the list. By passing log = true TUI will display values that a stream yielded.
Threads monitoring
It’s enabled by default via threads feature flag. TUI dashboard displays displays real-time information about all active and sleeping threads in the instrumented process. For each thread, you can observe:
- PID – Process identifier
- Total Alloc – Dealloc – Aggregate allocation delta for all threads
- RSS – Resident Set Size (total physical memory currently used)
and per-thread metrics:
- Thread Name – Logical name
- TID – System thread identifier
- Status – Current execution state (e.g.,
Sleeping,Running,Blocked, etc.) - CPU % – Instant CPU utilization per thread
- User / Sys Time – Cumulative user-mode and kernel-mode execution time
- Alloc / Dealloc – Total allocated and deallocated memory attributed to that thread
- Diff – Net allocation difference (growth or shrinkage in allocated memory since last refresh)
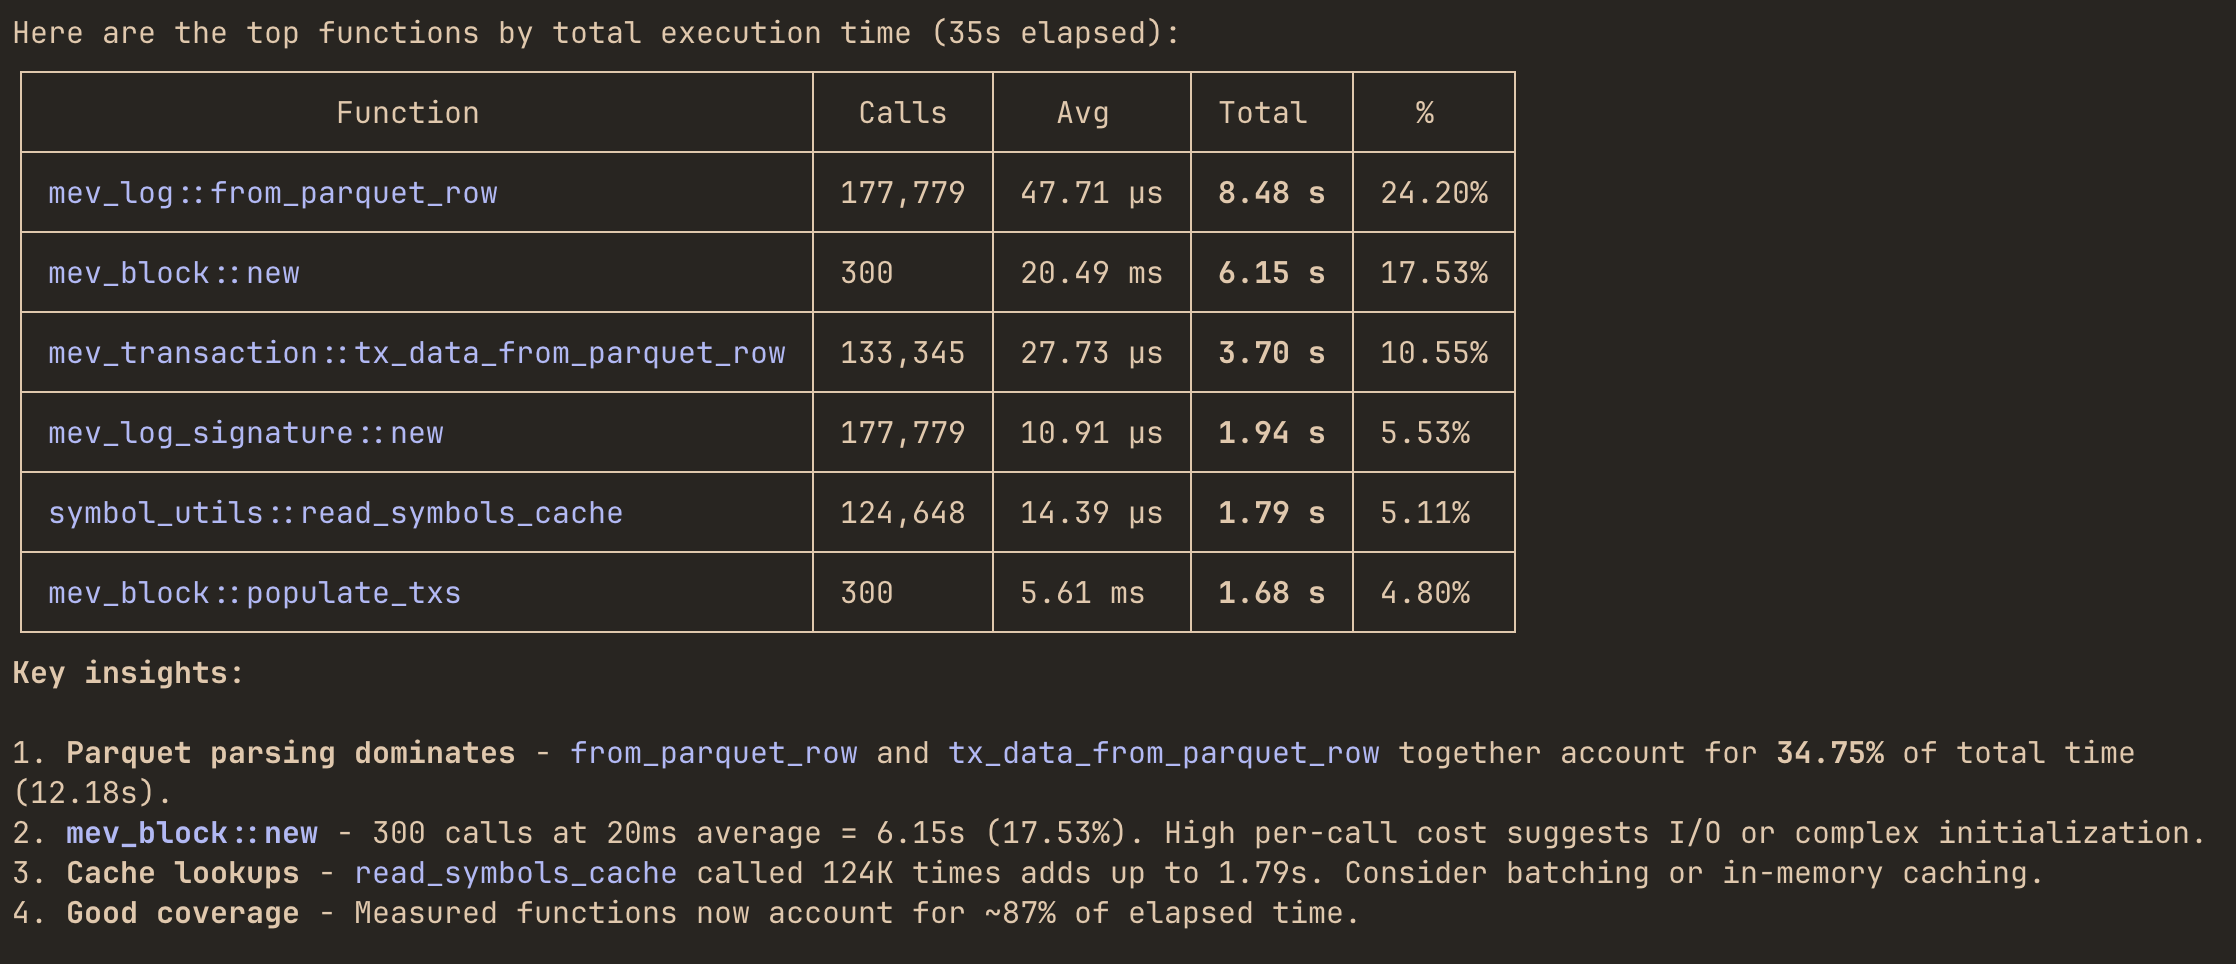
MCP integration
The Model Context Protocol (MCP) integration allows LLM agents like Claude Code to query your Rust application’s profiling data in real-time. Instead of manually reading performance reports, you can ask questions like:
"Which functions dominate total execution time right now?""Where is most of my memory being allocated?""Which mpsc channel has the highest throughput and queue pressure?"
and get instant answers.
Setup
Run your program with the MCP enabled alongside profiling:
cargo run --features='hotpath,hotpath-alloc,hotpath-mcp'
Available tools
Summary tools
These tools return aggregated performance summaries:
| Tool | Description |
|---|---|
functions_timing | Function timing statistics (calls, avg, p99, total time) |
functions_alloc | Function memory allocation statistics |
channels | Channel metrics (sends, receives, buffer usage) |
streams | Stream metrics (items processed, throughput) |
futures | Future execution statistics |
threads | Thread activity and timing |
gauges | Custom gauge values |
Detailed log tools
These tools accept parameters to retrieve detailed execution logs:
| Tool | Parameters | Description |
|---|---|---|
function_timing_logs | function_name, limit | Individual timing logs for a function |
function_alloc_logs | function_name, limit | Individual allocation logs for a function |
channel_logs | channel_name, limit | Channel operation logs |
stream_logs | stream_name, limit | Stream operation logs |
future_logs | future_name, limit | Future execution logs |
gauge_logs | gauge_name, limit | Gauge value history |
Configuration
| Environment Variable | Default | Description |
|---|---|---|
HOTPATH_MCP_PORT | 6771 | Port the MCP server listens on |
HOTPATH_MCP_AUTH_TOKEN | - | Optional authentication token for secure access |
Example with custom configuration:
HOTPATH_MCP_PORT=8080 HOTPATH_MCP_AUTH_TOKEN=secret123 \
cargo run --features='hotpath,hotpath-mcp'
Claude Code setup
Basic setup (no authentication)
claude mcp add --transport http hotpath http://localhost:6771/mcp
"mcpServers": {
    "hotpath": {
        "type": "http",
        "url": "http://localhost:6771/mcp"
    }
}
With authentication
If you’ve set HOTPATH_MCP_AUTH_TOKEN:
claude mcp add --transport http hotpath http://localhost:6771/mcp --header "Authorization: your-secret-token"
"mcpServers": {
    "hotpath": {
        "type": "http",
        "url": "http://localhost:6771/mcp",
        "headers": {
            "Authorization": "your-secret-token"
        }
    }
}
After that, you can ask the model to answer performance questions directly using live profiling data.
Example queries
Once connected, you can ask LLMs questions about your running application:
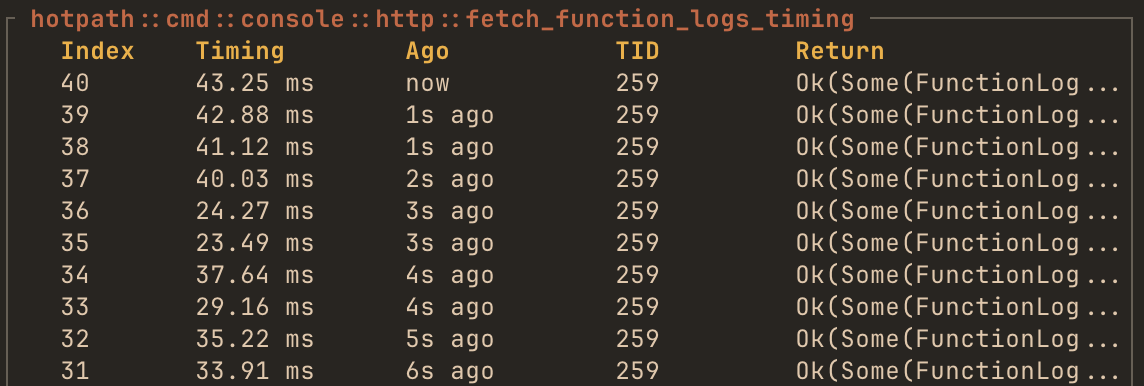
"Which functions dominate total execution time right now?""Where is most of my memory being allocated?""Which mpsc channel has the highest throughput and queue pressure?""Are any functions showing high p95 or p99 latency spikes?""Show the last 10 execution timing events for process_request function""Compare latency and allocation behavior of sync_handler vs async_handler methods""Which threads are currently consuming the most CPU and memory?""Are any threads steadily allocating memory without deallocating it?"
Agent will use the appropriate MCP tools to query your application’s profiling data and provide insights.
GitHub CI integration
WIP