AI-powered Rust profiling: query performance metrics with LLMs via MCP
The Model Context Protocol (MCP) integration allows LLM agents like Claude Code to query your Rust application’s performance metrics in real-time. Instead of manually reading profiling reports, you can ask questions like:
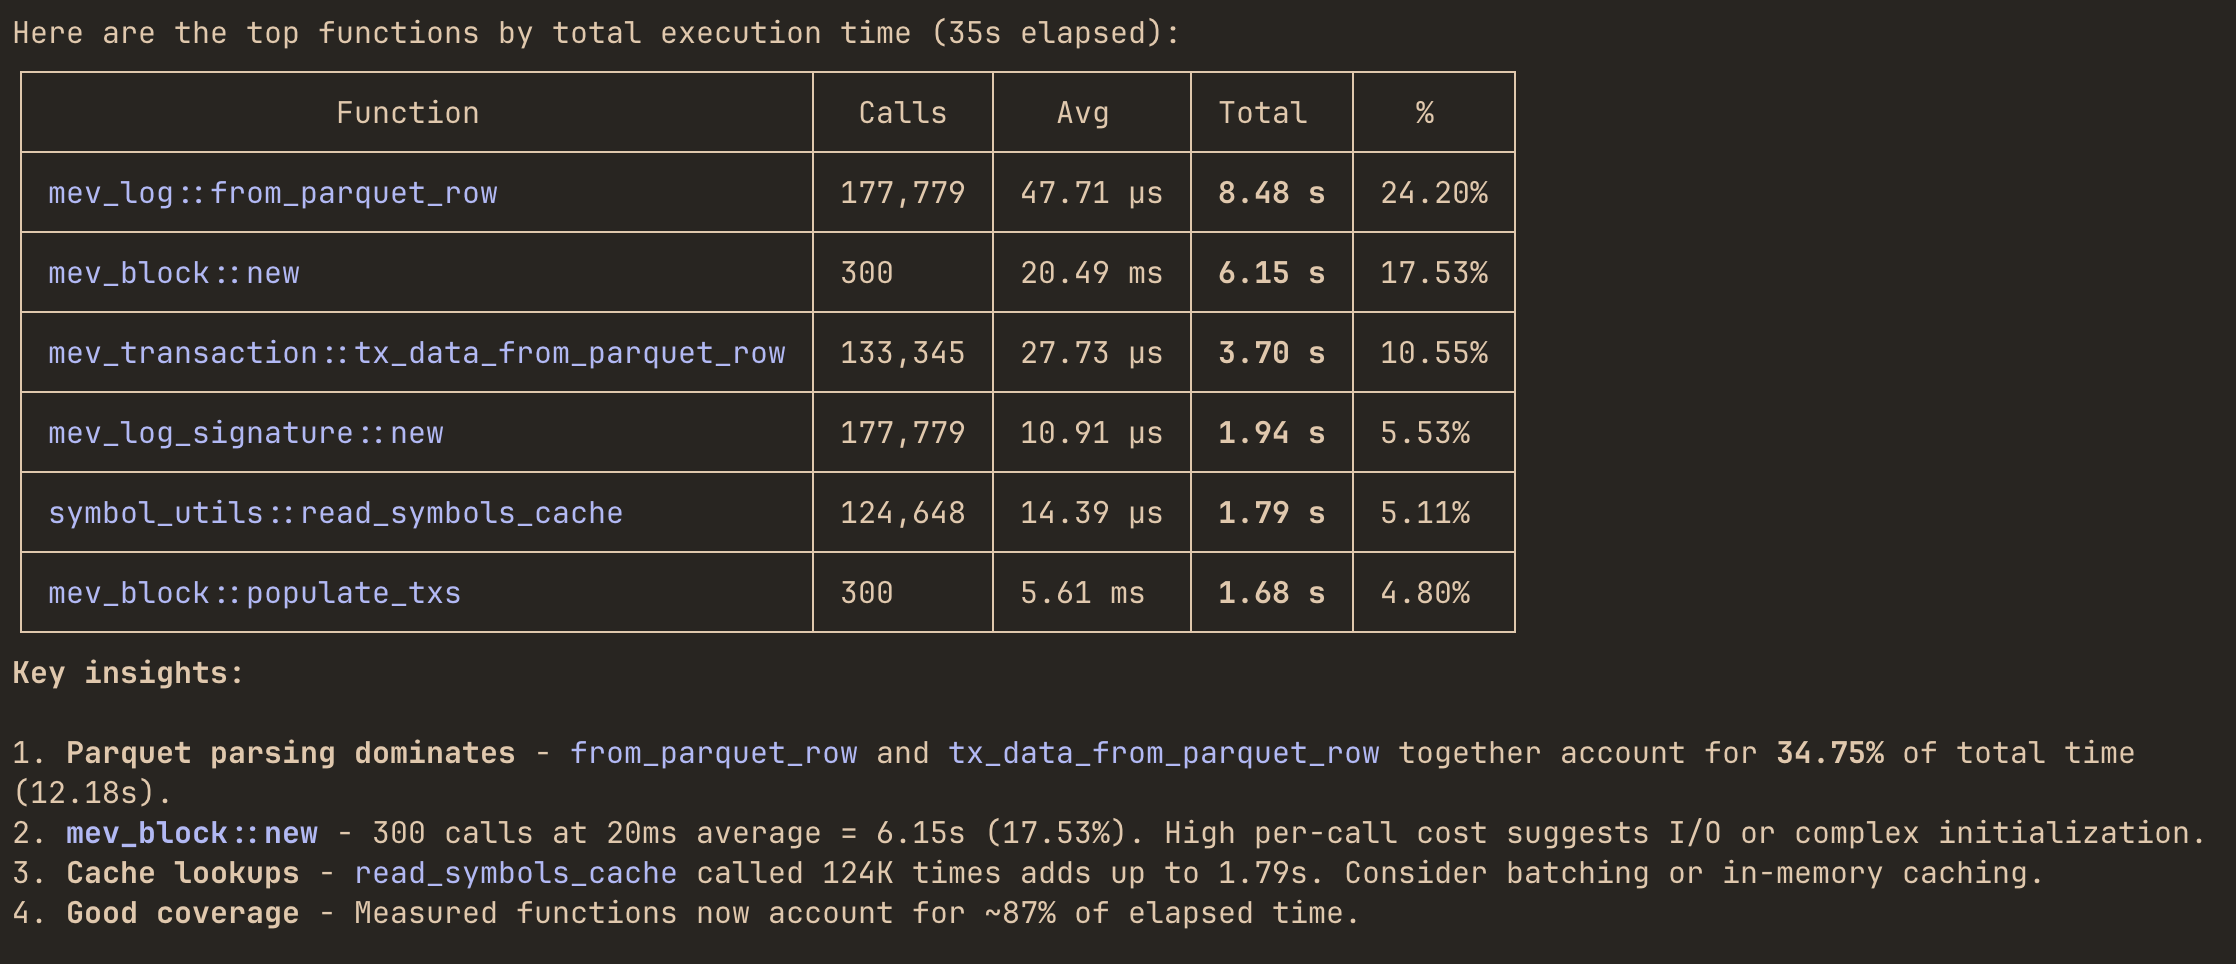
"Which functions dominate total execution time right now?""Where is most of my memory being allocated?""Which mpsc channel has the highest throughput and queue pressure?"
and get instant answers.
Setup
Run your program with the MCP enabled alongside profiling:
cargo run --features='hotpath,hotpath-alloc,hotpath-mcp'
Available tools
Summary tools
These tools return aggregated performance summaries:
| Tool | Description |
|---|---|
functions_timing | Function timing statistics (calls, avg, p99, total time) |
functions_alloc | Function memory allocation statistics |
functions_cpu | CPU sampling attribution per function (requires hotpath-cpu feature) |
functions_cpu_snapshot | Trigger an on-demand CPU sampling snapshot (requires hotpath-cpu feature) |
channels | Channel metrics (sends, receives, buffer usage) |
streams | Stream metrics (items processed, throughput) |
futures | Future execution statistics |
rw_locks | RwLock read/write wait & acquire-time statistics |
mutexes | Mutex wait & acquire-time statistics |
sql | SQL query execution-time statistics per normalized query (requires sqlx_tracing_layer()) |
threads | Thread activity and timing |
gauges | Custom gauge values |
dbg_entries | All dbg! debug entries |
val_entries | All val! value tracking entries |
tokio_runtime | Tokio runtime metrics snapshot (requires tokio feature) |
profiler_status | Profiler uptime status |
Detailed log tools
These tools accept parameters to retrieve detailed execution logs:
| Tool | Parameters | Description |
|---|---|---|
function_timing_logs | function_name, limit | Individual timing logs for a function |
function_alloc_logs | function_name, limit | Individual allocation logs for a function |
channel_logs | channel_name, limit | Channel operation logs |
stream_logs | stream_name, limit | Stream operation logs |
future_logs | future_name, limit | Future execution logs |
sql_logs | sql_id | Individual execution logs for a SQL query |
gauge_logs | gauge_name, limit | Gauge value history |
dbg_logs | debug_id | Detailed logs for a dbg! entry |
val_logs | debug_id | Detailed logs for a val! entry |
Configuration
| Environment Variable | Default | Description |
|---|---|---|
HOTPATH_MCP_PORT | 6771 | Port the MCP server listens on |
HOTPATH_MCP_AUTH_TOKEN | - | Optional authentication token for secure access |
Example with custom configuration:
HOTPATH_MCP_PORT=8080 HOTPATH_MCP_AUTH_TOKEN=secret123 \
cargo run --features='hotpath,hotpath-mcp'
Claude Code setup
Basic setup (no authentication)
claude mcp add --transport http hotpath http://localhost:6771/mcp
"mcpServers": {
    "hotpath": {
        "type": "http",
        "url": "http://localhost:6771/mcp"
    }
}
With authentication
If you’ve set HOTPATH_MCP_AUTH_TOKEN:
claude mcp add --transport http hotpath http://localhost:6771/mcp --header "Authorization: your-secret-token"
"mcpServers": {
    "hotpath": {
        "type": "http",
        "url": "http://localhost:6771/mcp",
        "headers": {
            "Authorization": "your-secret-token"
        }
    }
}
After that, you can ask the model to answer performance questions directly using live profiling data.
Example queries
Once connected, you can ask LLMs questions about your running application:
"Which functions dominate total execution time right now?""Where is most of my memory being allocated?""Which mpsc channel has the highest throughput and queue pressure?""Are any functions showing high p95 or p99 latency spikes?""Show the last 10 execution timing events for process_request function""Compare latency and allocation behavior of sync_handler vs async_handler methods""Which threads are currently consuming the most CPU and memory?""Are any threads steadily allocating memory without deallocating it?"
Agent will use the appropriate MCP tools to query your application’s profiling data and provide insights.