Real-time Rust performance, memory and data flow profiler

hotpath-rs instruments functions, channels, futures, and streams to quickly find bottlenecks and focus optimizations where they matter most. It provides actionable insights into time, memory, and data flow with minimal setup.
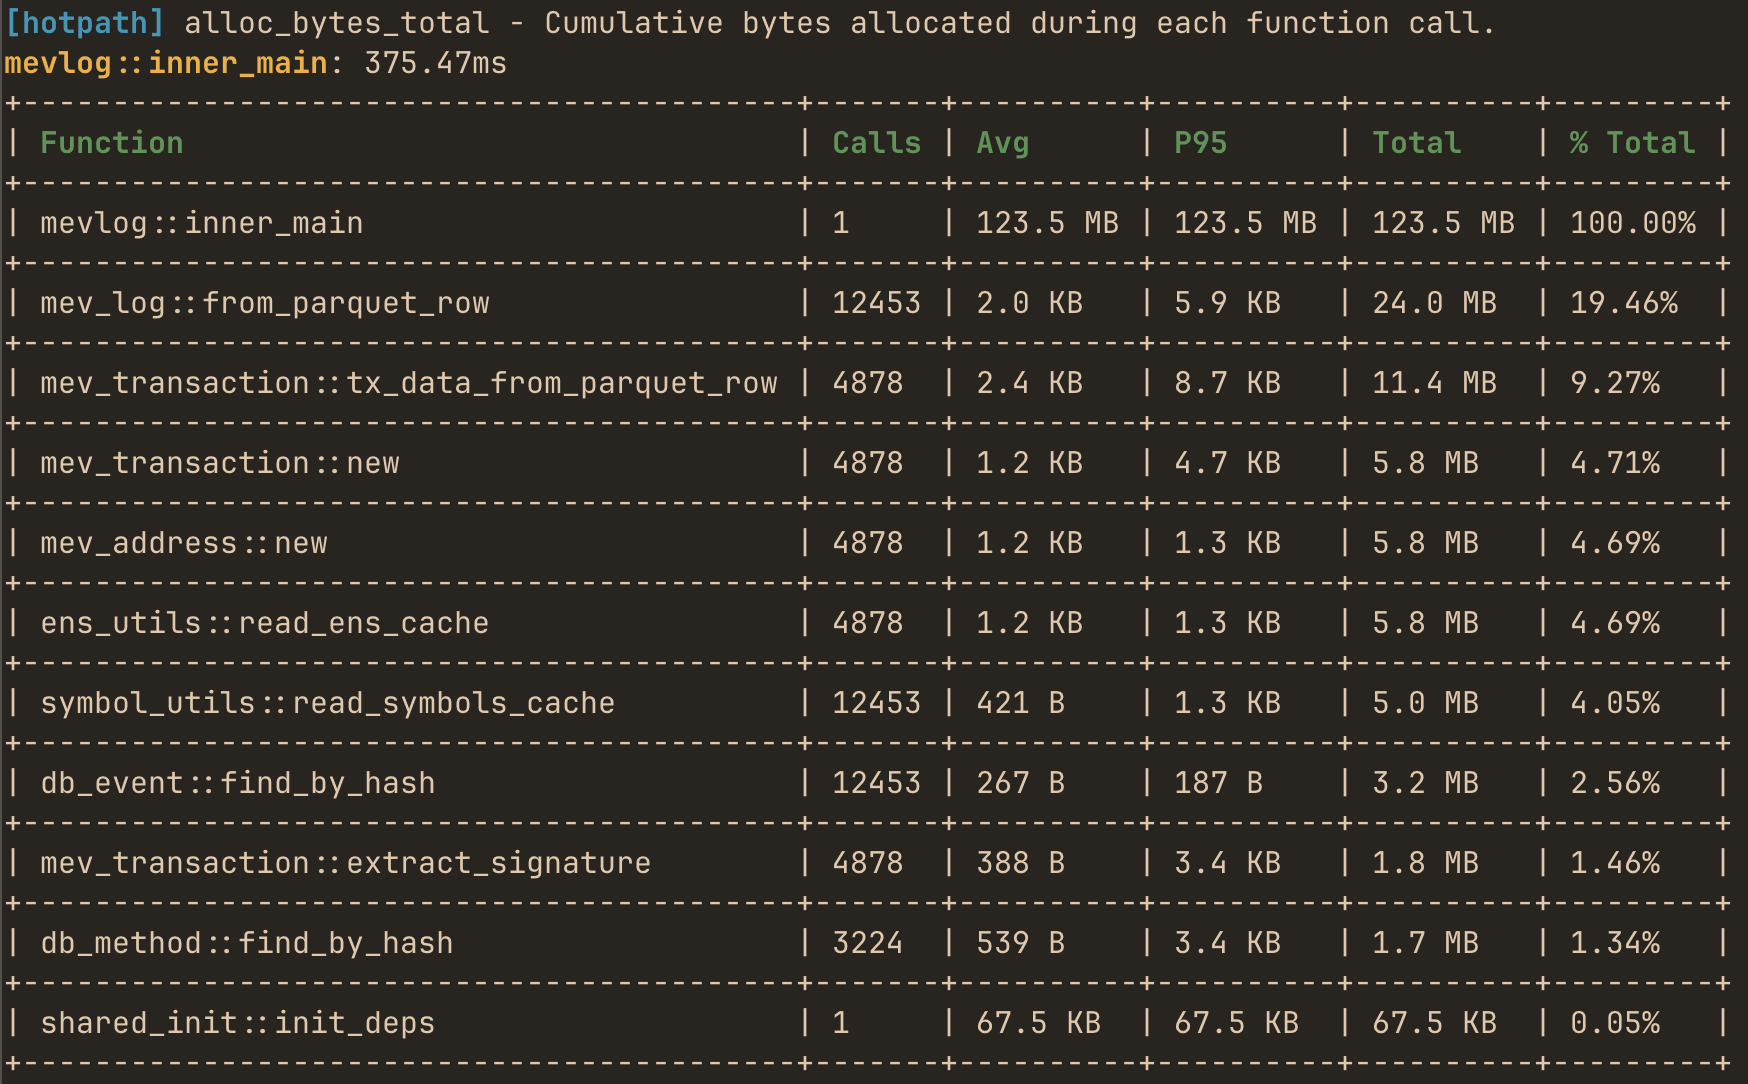
You can use it to produce one-off performance (timing or memory) reports:
or use the live TUI dashboard to monitor real-time performance and data flow metrics with debug info:
Features
- Zero-cost when disabled - fully gated by a feature flag.
- Low-overhead profiling for both sync and async code.
- Live TUI dashboard - real-time monitoring of performance data flow metrics in TUI dashboard (built with ratatui.rs).
- Static reports for one-off programs - alternatively print profiling summaries without running the TUI.
- Memory allocation tracking - track bytes allocated and allocation counts per function.
- Channels, futures and streams monitoring - track messages flow and throughput.
- Detailed stats: avg, total time, call count, % of total runtime, and configurable percentiles (p95, p99, etc.).
- GitHub Actions integration - configure CI to automatically benchmark your program against a base branch for each PR
Quick demo
An easy way to quickly try the TUI is to run it in auto-instrumentation mode. The TUI process profiles itself and displays its own performance metrics in real time.
First, install hotpath CLI with auto-instrumentation enabled:
cargo install hotpath --features='tui,hotpath,hotpath-alloc'
Then launch the console:
hotpath console
and you’ll see timing, memory and channel usage metrics.
Make sure to reinstall it without the auto-profiling features so that you can also observe metrics of other programs!
cargo install hotpath --features='tui'
Installation
Add to your Cargo.toml:
[dependencies]
hotpath = "0.9"

[features]
hotpath = ["hotpath/hotpath"]
hotpath-alloc = ["hotpath/hotpath-alloc"]
This config ensures that the lib has no compile time or runtime overhead unless explicitly enabled via a hotpath feature. All the lib dependencies are optional (i.e. not compiled) and all macros are noop unless profiling is enabled.
Learn more
See the rest of the docs to learn how to instrument and profile your program:
- Sampling Comparison - when to use
hotpathvs CPU sampling profilers - Profiling modes - static reports vs live TUI dashboard
- Functions - measure execution time and memory allocations
- Futures - monitor async code, poll counts, and resolved values
- Channels - track messages flow and throughput
- Streams - instrument async streams
- Threads - monitor threads usage
- GitHub CI integration - benchmark PRs automatically