Rust HTTP Client Performance Profiling for reqwest and ureq
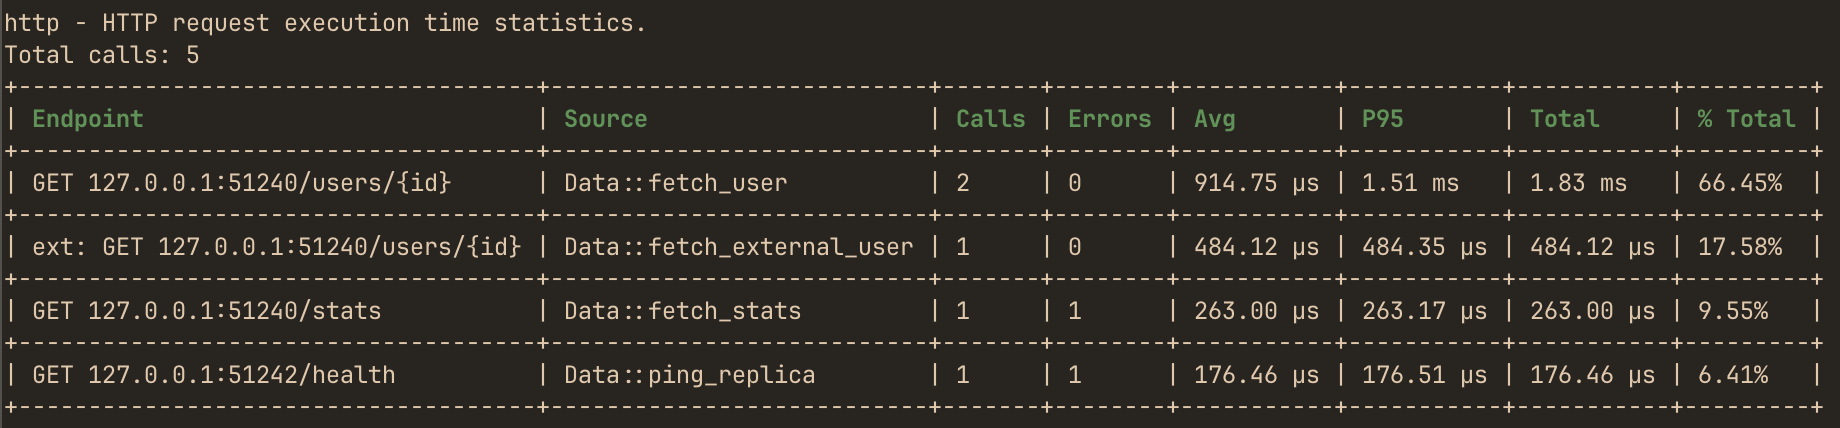
hotpath profiles outgoing HTTP requests made with reqwest or ureq, helping you identify slow endpoints, frequent request patterns, and failing calls. Requests are grouped by normalized endpoint, so parameter-varied requests to the same route are reported together: 1,000 calls to GET example.com/users/{id} appear as a single entry with call count, error count, average latency, percentiles, and total execution time.
The guide to profiling slow HTTP calls in Rust uses this report to spot sequential requests and run them in parallel.
Wrapping the reqwest client
Add hotpath with the feature matching your reqwest crate version to your Cargo.toml:
[dependencies]
hotpath = { version = "0.29", features = ["reqwest-0-13"] } # or "reqwest-0-12"
Wrap the client once at creation with the http! macro to profile requests sent through it:
let client = hotpath::http!(reqwest::Client::new());

// Normal reqwest usage from here on:
let resp = client.get("https://example.com/users/1").send().await?;
Under the hood the macro wraps the client with reqwest-middleware’s ClientWithMiddleware and attaches hotpath’s timing middleware. Common request-building methods (get, post, json, header, …) work as usual.
To store the client in a struct, use an alias that works with profiling on or off:
struct App {
    client: hotpath::wrap::reqwest::Client,
}
With hotpath enabled the type is ClientWithMiddleware; disabled the alias is the raw reqwest::Client.
If you name the error type returned by send() or execute(), use hotpath::wrap::reqwest::Error. For example, stripping URLs from errors works in both profiling modes:
let resp = client.get("https://example.com/users/1").send().await
    .map_err(hotpath::wrap::reqwest::Error::without_url)?;
Propagation with ? into anyhow, eyre, or Box<dyn std::error::Error> needs no changes. Response methods such as json(), text(), and error_for_status() still return raw reqwest::Error.
The alias is reqwest-middleware’s Error with profiling on and reqwest::Error with it off.
Labels
An optional label prefixes every endpoint key produced by the client:
let github = hotpath::http!(reqwest::Client::new(), label = "github");
// -> "github: GET api.github.com/repos/{id}"
Existing reqwest-middleware stacks
If your app already uses reqwest-middleware (e.g. for retries), skip the macro and attach the hotpath::ReqwestHttpMiddleware middleware directly:
let client = reqwest_middleware::ClientBuilder::new(reqwest::Client::new())
    .with(hotpath::ReqwestHttpMiddleware::new())
    .with(RetryTransientMiddleware::new_with_policy(retry_policy))
    .build();
Stack order matters: placed before a retry middleware, hotpath times the total including retries; placed after it, each attempt is timed separately.
Instrumenting a ureq agent
Enable the ureq-3 feature (ureq 3.x):
[dependencies]
hotpath = { version = "0.29", features = ["ureq-3"] }
ureq registers middleware on the agent’s config builder, so the http! macro takes the ConfigBuilder rather than a finished agent. It returns the same builder with hotpath’s middleware appended - build the agent from it as usual:
let agent: ureq::Agent = hotpath::http!(ureq::Agent::config_builder())
    .build()
    .new_agent();

// Normal ureq usage from here on:
let resp = agent.get("https://example.com/users/1").call()?;
The type doesn’t change across profiling modes: with hotpath disabled the macro returns the builder untouched, so no hotpath::wrap alias is needed. Labels work the same way as for reqwest (hotpath::http!(ureq::Agent::config_builder(), label = "github")).
To control where hotpath sits in an existing middleware chain, skip the macro and add hotpath::UreqHttpMiddleware yourself. The type compiles into a pass-through middleware when hotpath is disabled, so the line can stay in place unconditionally:
let agent: ureq::Agent = ureq::Agent::config_builder()
    .middleware(hotpath::UreqHttpMiddleware::new())
    .build()
    .new_agent();
ureq’s default http_status_as_error(true) returns 4xx/5xx responses as Err(ureq::Error::StatusCode(..)); hotpath recovers the status from that error, so those requests are recorded with their status (and counted in Errors) rather than as transport failures.
Normalizing endpoints
Requests are grouped by METHOD host/path. The query string, fragment, and credentials are dropped, and path segments that look like identifiers collapse into {id}:
- all-digit segments (
/users/123) - UUIDs (
/jobs/550e8400-e29b-41d4-a716-446655440000) - hex strings of 16+ characters (
/blobs/deadbeefdeadbeef)
So GET /users/1?verbose=true and GET /users/42 merge into one GET example.com/users/{id} bucket. An explicit port becomes {port} (GET 127.0.0.1:{port}/users/{id}), so a test server bound to a free port keys the same across runs; the host itself is kept as written. Raw URLs never reach the report - only the normalized shape does.
Source function attribution
Each request is attributed to the innermost #[hotpath::measure]-instrumented function that issued it - the Source column in the report and TUI. hotpath maintains a per-thread stack of instrumented function names: sync functions push their name on entry and pop on return, and async functions push and pop around every poll, so tasks interleaved on one runtime thread never report a stale caller. The middleware captures the source when the request starts, before the first await, while it is still executing in the caller’s frame.
Source is part of the grouping key: the same endpoint hit from two different instrumented functions appears as two separate rows, so you can tell which code path is responsible for which share of the HTTP traffic. For blocking ureq calls the whole request runs on the caller’s thread, so attribution is simply the innermost instrumented function on the current call stack.
If no instrumented function is active when the request is sent - the request comes from uninstrumented code, or from a spawned task whose functions aren’t instrumented - the Source column shows -. To get attribution, annotate the functions that send requests (or their callers) with #[hotpath::measure].
In axum applications wrapped with hotpath::axum! outbound requests are additionally grouped by the server route that issued them, shown in a Route column.
Error tracking
Each bucket has an Errors column counting transport errors (DNS failures, connection refused, timeouts) plus responses with status >= 400.
Limiting and capping endpoint output
The number of endpoints shown is unlimited by default (0). Cap it with:
- Builder:
.http_limit(n) - Env var:
HOTPATH_HTTP_LIMIT
What is measured
The middleware times reqwest’s execute future (or, for ureq, the blocking next.handle(req) call), which resolves at a specific protocol moment: when the response status line and headers have been fully received. The Response returned at that point holds an open handle onto the connection - body bytes flow only when your code later awaits .json(), .text(), .bytes(), or polls .bytes_stream() (reads body_mut() for ureq), and by then the measurement is already recorded.
Included in the measured window:
- DNS resolution, TCP connect, and TLS handshake - but only when no pooled connection is reused; requests over a warm connection pool skip these
- Sending the request, including uploading the full request body
- Redirect hops (reqwest’s
executeand ureq’s agent both follow redirects internally, so each hop’s full round trip counts, bucketed under the original pre-redirect URL) - Server processing time, up to receipt of the response headers
Excluded:
- Downloading the response body, decompression, and JSON deserialization
Note the asymmetry: request-body upload is inside the window, response-body download is outside it.
In practice the metric behaves like time-to-first-byte plus connection cost. An endpoint that is slow because the server computes for 800ms before answering shows up accurately. An endpoint that answers headers in 20ms and then streams 50MB of JSON for 4 seconds shows up as 20ms. A body-read failure also won’t appear in the Errors column - by then the request was already recorded with its response status. For SSE and long-poll endpoints that keep the body open indefinitely this is the behavior you want (the request would otherwise never “complete”); for large payload downloads it undercounts.
This boundary is inherent to the middleware interception point in both clients - the Middleware chain hands back the Response as soon as headers arrive, and body consumption belongs to the caller. It captures server latency reliably; it is not a measure of network throughput.
Other limitations
Only requests sent through wrapped clients are visible; HTTP calls made inside third-party crates holding their own reqwest::Client or ureq::Agent are not captured. For reqwest only the async client is supported - reqwest::blocking is not supported by hotpath::http!. For ureq only the agent-based API is instrumented; the free functions (ureq::get(..) etc.) use ureq’s global agent, which carries no middleware.