Rust CPU Profiling with samply
hotpath provides sampling-based CPU profiling for Rust using samply. Unlike pure instrumentation, CPU sampling shows where your program actually spends processor time, letting you tell apart CPU-bound, I/O-bound, and memory-bound bottlenecks. This guide covers installing samply, configuring permissions on macOS and Linux, and reading the CPU usage report.
By comparing the CPU report against the timing and allocation reports, you can pin down what kind of bottleneck you have: high wall-clock time but low CPU samples means I/O-bound (waiting), high CPU samples means CPU-bound (computing), and high allocation counts point to memory pressure. See Sampling comparison for a detailed explanation of how the profiling modes differ.
CPU profiling requires some additional system configuration, covered below.
Configuring samply CPU profiler
Start by installing samply:
cargo install samply --locked
and verify version:
samply --version
hotpath is tested to work with version 0.13.x.
Then install the hotpath-samply wrapper binary that ships with hotpath:
cargo install hotpath --bin hotpath-samply --version '^0.17.0'
Both samply and hotpath-samply must be available in your PATH at runtime. The host process spawns hotpath-samply as a child, which in turn invokes samply to record the profile.
If either binary lives outside PATH, point hotpath at it explicitly:
HOTPATH_SAMPLY_WRAPPER_BIN- path to thehotpath-samplywrapper binary the host process spawns (default:hotpath-samply, resolved viaPATH).HOTPATH_SAMPLY_BIN- path to the externalsamplybinary the wrapper invokes (default:samply, resolved viaPATH).
macOS: granting samply profiling permissions
Run:
samply setup
It will prompt you to sign samply binary so that it can attach to a running process by its PID.
Linux: enabling kernel profiling for samply
On Linux, CPU profiling requires elevated kernel profiling permissions. Run:
echo -1 | sudo tee /proc/sys/kernel/perf_event_paranoid
echo 0 | sudo tee /proc/sys/kernel/yama/ptrace_scope
echo 0 | sudo tee /proc/sys/kernel/kptr_restrict
These settings allow samply to attach to a running process and collect kernel-level profiling information.
The configuration is temporary and resets after reboot. Consider persisting it via /etc/sysctl.d/.
Another caveat when using samply with hotpath on Linux is that you must prefix the profiled command with setsid -w. So instead of:
cargo run --features='hotpath,hotpath-alloc,hotpath-cpu'
you should run:
setsid -w cargo run --features='hotpath,hotpath-alloc,hotpath-cpu'
Otherwise the parent process may exit before hotpath finishes the profiling report.
Using a Rust CPU profiler with hotpath
You must build with debug symbols enabled in order to attribute CPU samples to instrumented functions. Symbols are included by default in debug profile builds. --release builds don’t include this info, so you should use a dedicated profile instead:
Cargo.toml
[profile.profiling]
inherits = "release"
debug = true
Now run your example with an additional hotpath-cpu flag:
cargo run --features='hotpath,hotpath-alloc,hotpath-cpu' --profile profiling
it will output a CPU usage report (in addition to wall-clock time and allocations):
+------------------------+---------+---------+
| Function | Samples | % Total |
+------------------------+---------+---------+
| cpu_basic::sync_work | 1915914 | 56.13% |
+------------------------+---------+---------+
| cpu_basic::async_sleep | 14056 | 0.41% |
+------------------------+---------+---------+
| cpu_basic::sync_alloc | 1581 | 0.05% |
+------------------------+---------+---------+
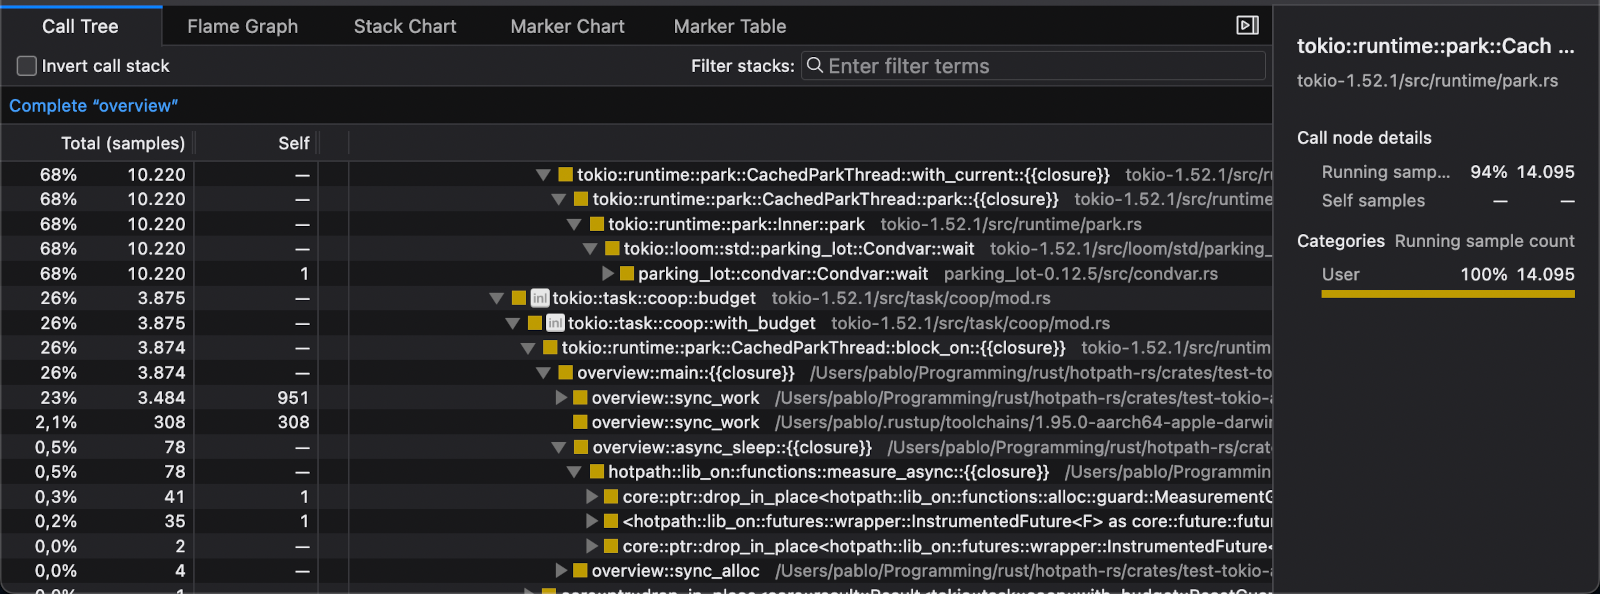
samply load /tmp/hotpath/61089-1778083683167502000/hp.json.gz
You can optionally run the displayed samply load command to open an interactive performance report:
Why inlined functions hide from CPU profilers
Standard CPU profilers sometimes miss top bottleneck functions because the compiler implicitly inlines small or hot functions. Once a function is inlined, its symbol disappears from the binary and its samples get attributed to the caller, hiding it from the report.
Under the hotpath-cpu feature, #[hotpath::measure] strip any user-provided #[inline(...)] attribute and inject #[inline(never)] instead. This forces the function to retain its own symbol so CPU samples attribute correctly.
To disable this rewrite, set HOTPATH_KEEP_INLINE=1. The variable is read at proc-macro expansion time, so touch the source file or run cargo clean after toggling it.
Improving symbol attribution for impl methods
Currently hotpath correctly attributes CPU usage to module functions instrumented with measure macro. impl functions instrumented with measure require an additional config.
impl Worker {
    #[hotpath::measure]
    fn run() {
      // ...
    }
}
The above example wouldn’t correctly attribute CPU samples to the run function, because it’s defined in an impl block. You have to explicitly declare impl_type to fix it:
impl Worker {
    #[hotpath::measure(impl_type = "Worker")]
    fn run() {
      // ...
    }
}
Alternatively you can use measure_all macro for impl functions to correctly attribute all symbols without additional config:
#[hotpath::measure_all]
impl Worker {
    fn run() {
      // ...
    }
}
Current status
CPU profiling support is still experimental, so bug reports and feedback are highly appreciated.