How to Profile Rust Performance using Grafana and Prometheus
Published: October 12, 2026
Reading time: 21 minutes
With agentic AI writing more code, production observability becomes critical to understanding what your app is actually doing. In this tutorial, I’ll show how to use the hotpath-rs Grafana & Prometheus integration to configure actionable performance metrics for your Rust application. We’ll discuss which signals are worth observing and how to ensure that profiling overhead does not impact your production deployment.
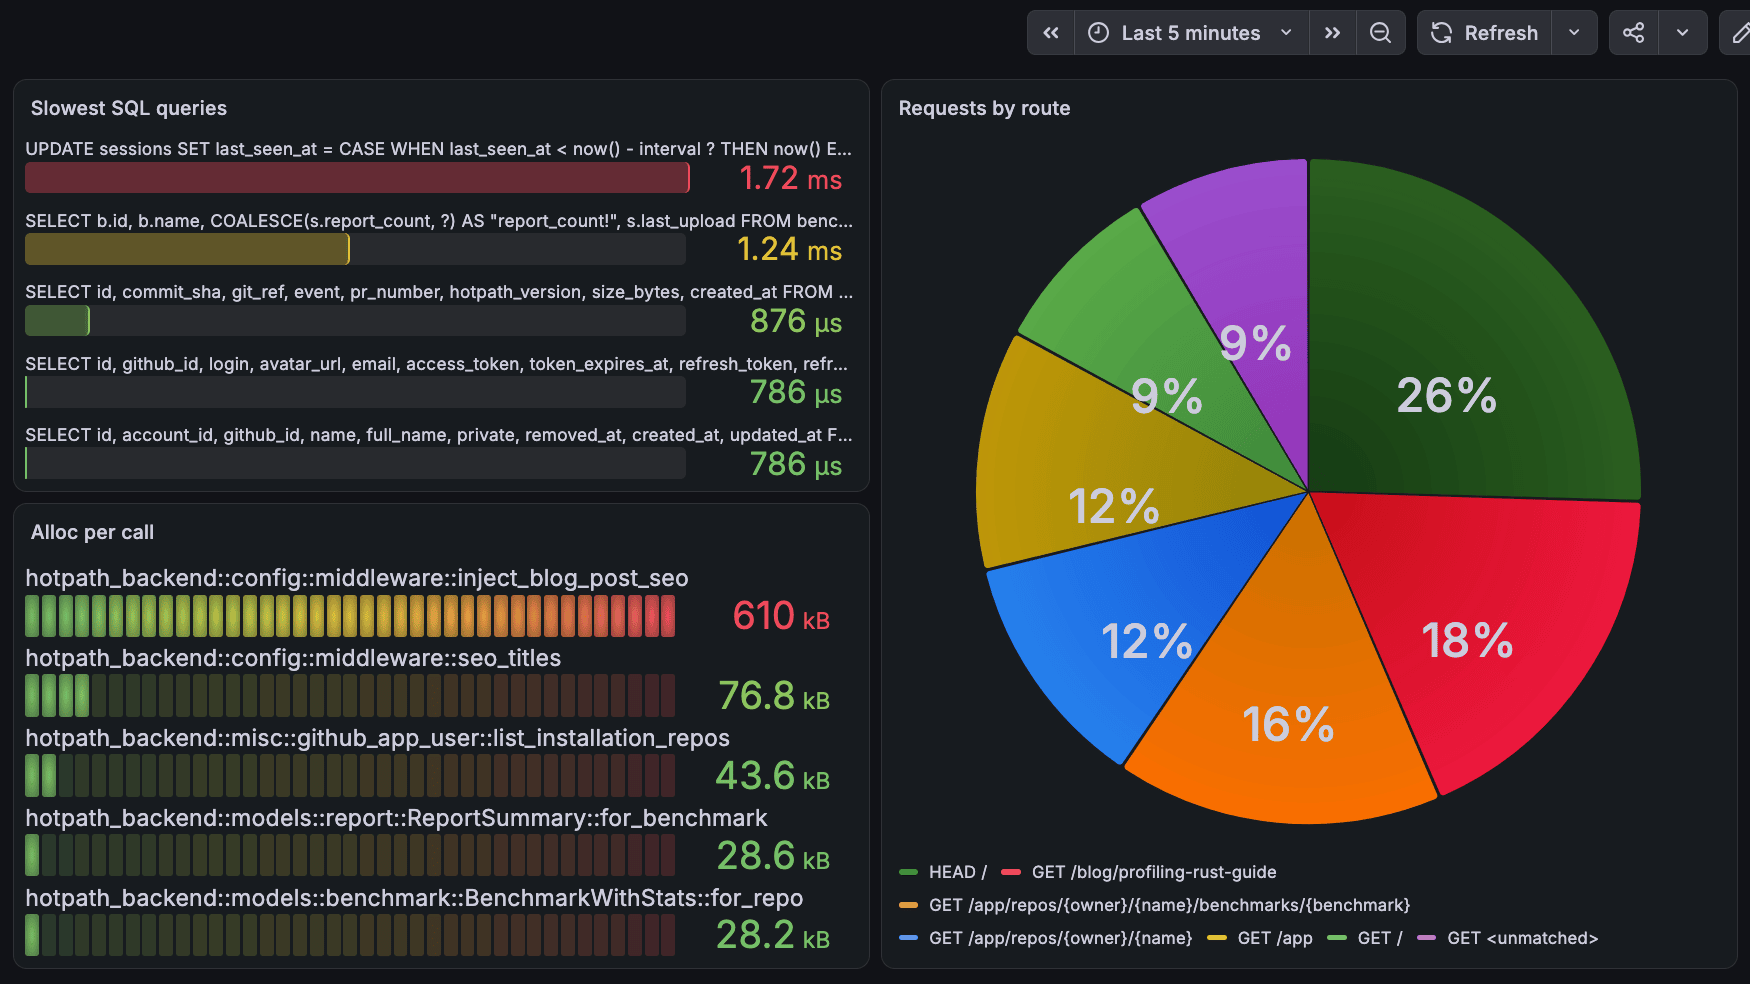
Getting started with Grafana in Rust
In this article I won’t describe how to get started with Grafana itself. There are numerous tutorials and AI skills dedicated to that. I assume you already have Grafana and Prometheus up and running.
Instead, we’ll focus on extracting metrics that provide useful insights without overwhelming you with distracting information. One issue I had when I started using Grafana was its almost infinite flexibility in how metrics can be queried and displayed. It makes deciding what’s actually worth monitoring difficult.
Consider two functions: A has a p95 of 10μs, while B takes over 5 seconds on average. So A is fast and B is slow? What if A is a low-level processing hotpath called millions of times, while B represents a long-running background job?
It all depends on CONTEXT. Raw function execution times or allocation metrics provide limited value without understanding how they relate to the application’s behavior. With AI writing increasingly more code, that context can be difficult to maintain even when you’re a supposed “author” of the feature.
That’s why in this article I’ll show how to instrument a Rust application in a way that provides useful insights even with limited knowledge of the underlying codebase. And when you do know the codebase well, the same metrics become even more useful.
How to configure Grafana and Prometheus metrics for Rust app?
hotpath-rs makes it extremely easy to expose raw performance metrics through a Prometheus-compatible endpoint. See the Grafana & Prometheus docs for detailed instructions and configuration options. But if your Rust app is already instrumented with hotpath, all you need to do is enable the hotpath-prometheus feature flag:
[dependencies]
hotpath = "0.28"

[features]
hotpath = ["hotpath/hotpath"]
hotpath-alloc = ["hotpath/hotpath-alloc"]
hotpath-prometheus = ["hotpath/hotpath-prometheus"]
run your process with this flag:
cargo run --features='hotpath,hotpath-alloc,hotpath-prometheus'
and your metrics will be exposed at the default 6772 port:
curl http://127.0.0.1:6772/metrics | head

# # TYPE hotpath_build_info gauge
# hotpath_build_info{hotpath_version="0.28.3",rustc_version="1.98.0",profile="debug",os="macos-aarch64"} 1
# # HELP hotpath_uptime_seconds Seconds since profiling started.
# # TYPE hotpath_uptime_seconds gauge
# hotpath_uptime_seconds 3.309838291
# # HELP hotpath_function_calls_total Total calls of each instrumented function, including calls skipped by time sampling.
# # TYPE hotpath_function_calls_total counter
# hotpath_function_calls_total{function="hotpath::cmd::console::app::App::new"} 1
# hotpath_function_calls_total{function="hotpath::cmd::console::app::data::App::handle_data_response"} 8
Now point your Prometheus scraper at the endpoint and you’re good to go!
This could be the end of the tutorial. But read on if you’re interested in how hotpath-rs provides context-rich metrics that are easy to reason about.
Layers of performance observability
I’ve described my approach to optimizing Rust applications in the Rust performance profiling guide, so check it out to improve your context window. The core idea is to apply a Pareto principle mindset to performance optimization: focusing on high-level layers can take 5% of the effort while accounting for 95% of the potential improvements.
Before migrating to Rust, I worked as a Ruby on Rails performance consultant for ~5 years and used the same approach when optimizing RoR backends. See My Recipe for Optimizing Performance of Rails Applications for more details.
This layered observability approach translates directly to how a useful Grafana dashboard can be structured. hotpath-rs lets you monitor different performance layers separately while using each one to provide context for the others.
That’s enough “performance philosophy” for now. Let’s look at some code and charts.
The sample metrics below come from the production deployment of hotpath-backend, the Axum app powering this blog and hotpath Cloud app.
SQL query performance in Grafana
Let’s start with SQL query performance. Database interactions are often among the biggest bottlenecks in backend applications. hotpath-rs offers SQL performance tracing for popular SQL libraries. The instrumentation is agnostic to the underlying database engine, so it works with PostgreSQL, SQLite, and others.
The following Grafana query shows where your app spends its database time. Each bar represents the percentage of total SQL execution time spent by a single query, accounting for both how slow the query is and how often it runs:
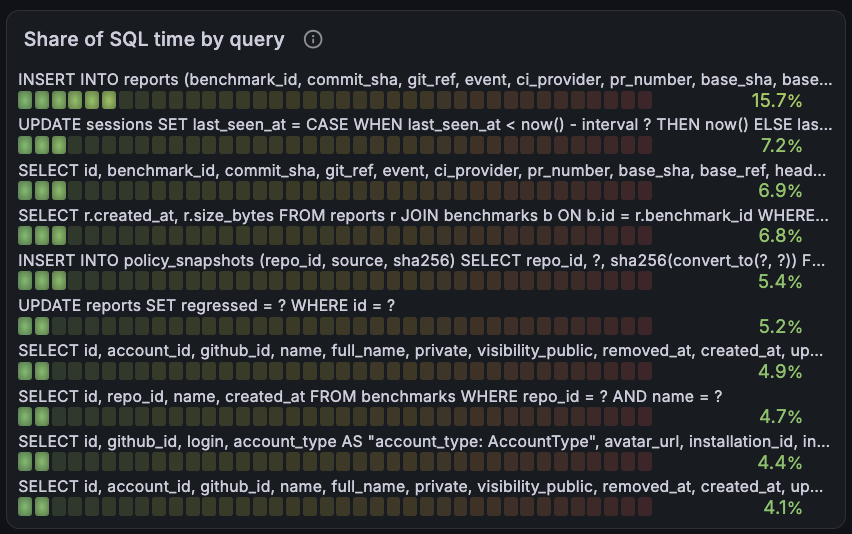
sort_desc(
  topk(
    10,
    100 * sum by (query) (
      histogram_sum(
        increase(hotpath_sql_duration_seconds[$__range])
      )
    )
    / on() group_left()
    sum(
      histogram_sum(
        increase(hotpath_sql_duration_seconds[$__range])
      )
    )
  )
)
Alternatively, you can use the following query to show only queries that cross a defined slowness threshold, e.g. p95 > 500ms, making it easy to spot candidates for optimization:
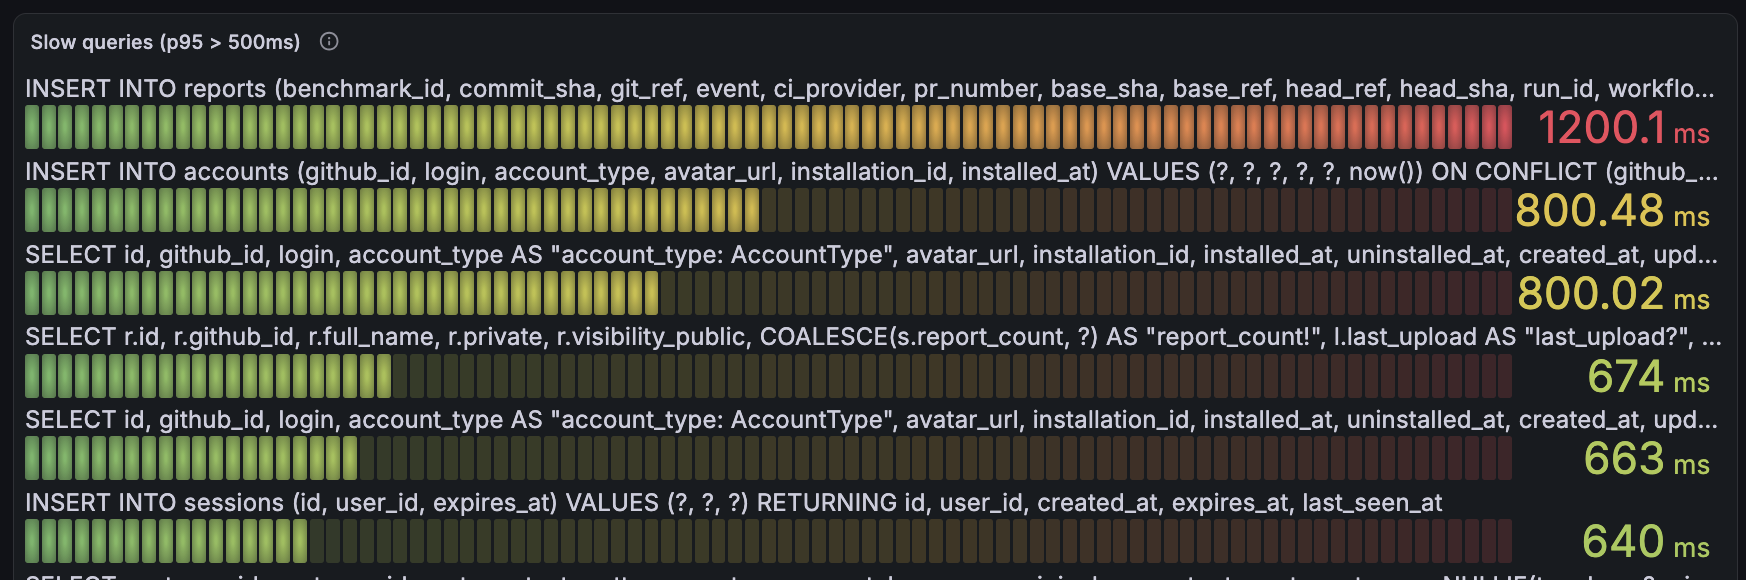
sort_desc(
  histogram_quantile(
    0.95,
    sum by (query) (
      increase(hotpath_sql_duration_seconds[$__range])
    )
  ) > 0.500
)
Context-aware SQL performance metrics
The metrics above can also be extracted directly from the database, for example with tools like pg-extras-rs. You don’t need to run a dedicated profiler for that.
Where hotpath-rs really starts to show its value is in contextualizing those metrics. If you’re using Axum for your backend, you can analyze each SQL query in the context of the route that executed it.
Let’s start with a chart showing which Axum endpoints contribute most to the application’s total processing time:
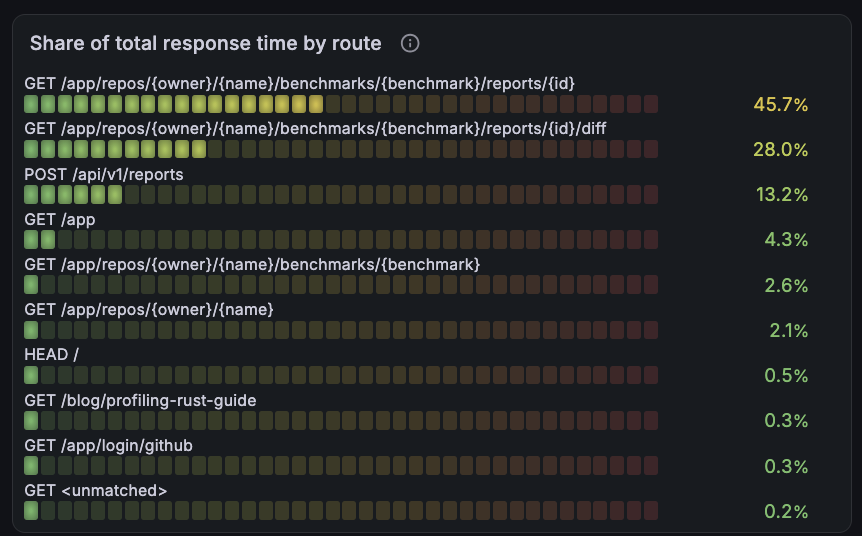
sort_desc(
  topk(
    10,
    100 * sum by (route) (
      histogram_sum(
        increase(hotpath_server_duration_seconds[$__range])
      )
    )
    / on() group_left()
    sum(
      histogram_sum(
        increase(hotpath_server_duration_seconds[$__range])
      )
    )
  )
)
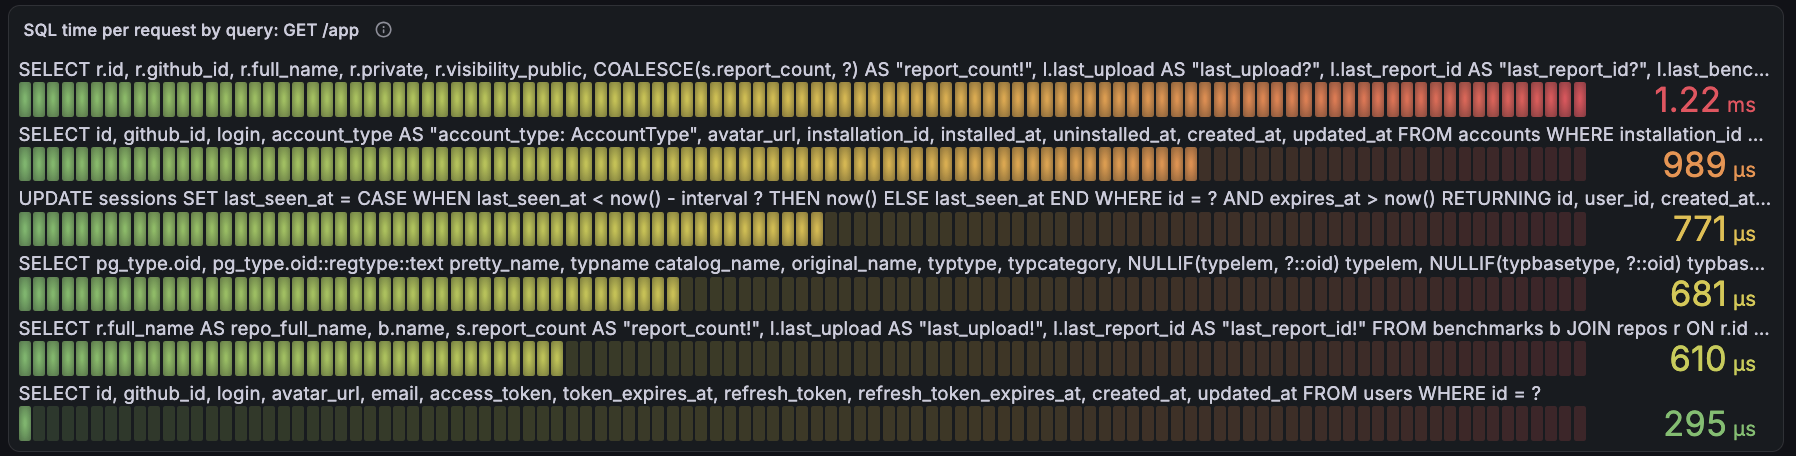
Now we can add a selector to inspect exactly which SQL queries are executed by each endpoint, and how much time each of them adds to a single request:
sort_desc(
  topk(
    10,
    sum by (query) (
      histogram_sum(
        increase(hotpath_sql_duration_seconds{route=~"$route"}[$__range])
      )
    )
    /
    scalar(
      sum(
        increase(hotpath_server_scoped_requests_total{route=~"$route"}[$__range])
      )
    )
  )
)
$route is a Grafana query variable populated with label_values(hotpath_server_requests_total, route).
With this setup in place, you can easily discover which SQL queries meaningfully contribute to response time and which can be safely ignored, even without an in-depth knowledge of the underlying codebase.
Detecting N+1 SQL queries in Rust
N+1 queries are one of the most common causes of slowdowns in backend applications. An endpoint loads a list of records and then runs a separate query for each one. This can be fast with a few rows in development but gets progressively slower as production data grows. Because each individual query is fast, it may never show up in a slow query report.
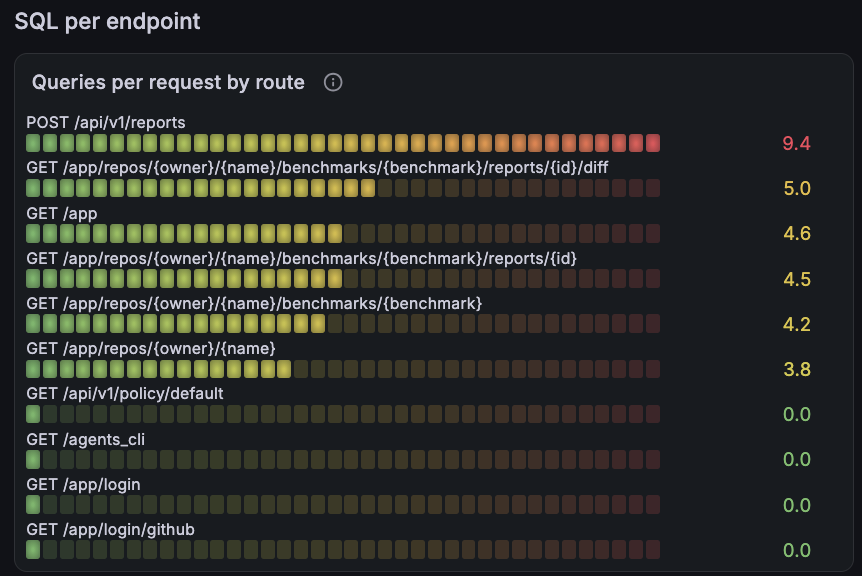
Since hotpath-rs knows which Axum route executed each query, we can calculate how many SQL queries a single request triggers on average:
sort_desc(
  topk(
    10,
    sum by (route) (
      increase(hotpath_server_sql_calls_total[$__range])
    )
    /
    (
      sum by (route) (
        increase(hotpath_server_scoped_requests_total[$__range])
      ) > 0
    )
  )
)
Endpoints with an unexpectedly high number of queries per request are prime N+1 candidates. You can add a threshold, e.g. > 5, to show only the endpoints that cross it.
Measuring HTTP call overhead
Next to SQL queries, HTTP calls are often another major contributor to a backend application’s response time.
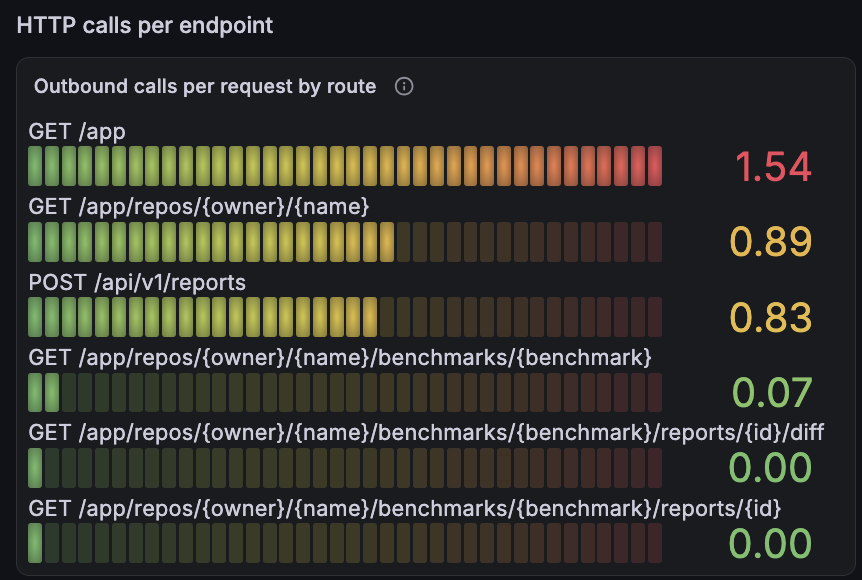
A useful graph can show how many HTTP calls each endpoint triggers on average. Multiple blocking HTTP calls can cause a problem similar to N+1 queries, with response times quickly growing as the number of calls increases:
sort_desc(
  topk(
    10,
    (
      sum by (route) (
        increase(hotpath_server_http_calls_total[$__range])
      ) > 0
    )
    /
    (
      sum by (route) (
        increase(hotpath_server_scoped_requests_total[$__range])
      ) > 0
    )
  )
)
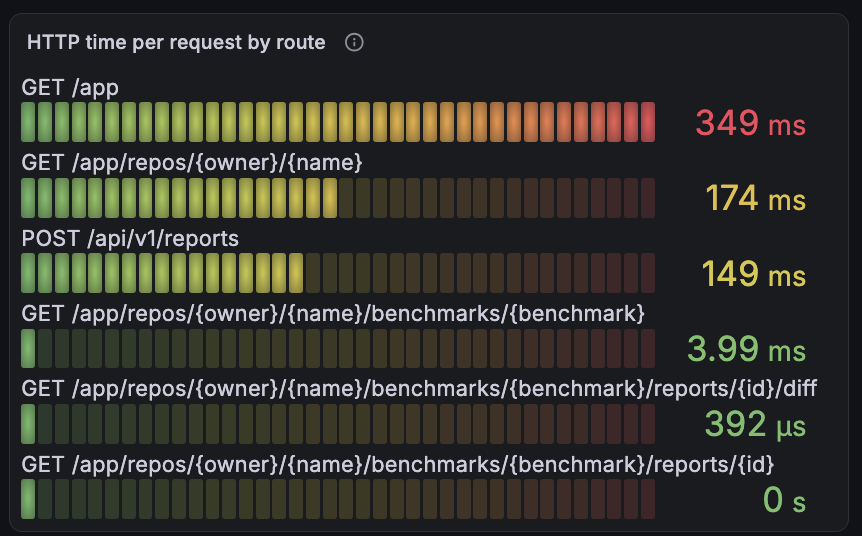
The next chart shows how much time a request to each endpoint spends waiting on blocking HTTP calls. A route that makes only one outbound call per request can still be the slowest if that call hits a slow external API:
sort_desc(
  topk(
    10,
    sum by (route) (
      histogram_sum(
        increase(hotpath_http_duration_seconds{route!=""}[$__range])
      )
    )
    /
    (
      sum by (route) (
        increase(hotpath_server_scoped_requests_total[$__range])
      ) > 0
    )
  )
)
route!="" filters out HTTP calls made outside of a request, e.g. by background jobs.
You can compare this HTTP overhead with the slowest endpoint response times to identify which blocking calls are worth optimizing or moving to the background.
Memory usage per request
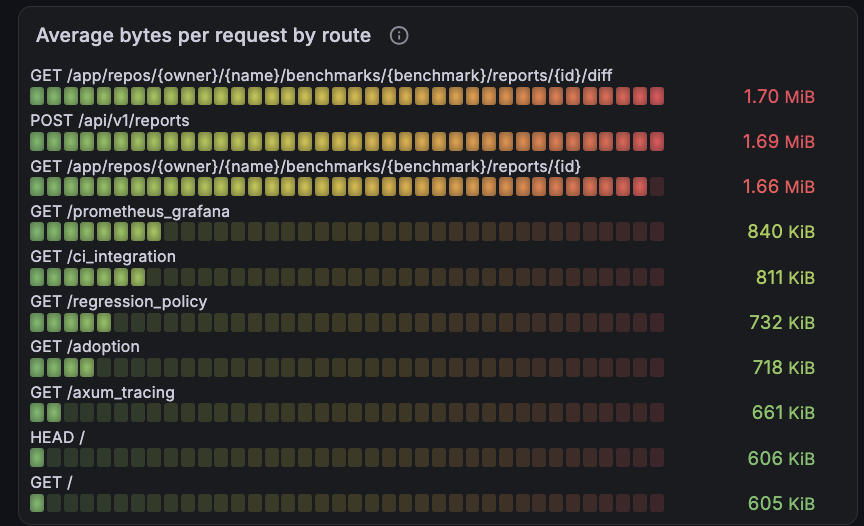
With the hotpath-alloc feature enabled, hotpath-rs also tracks how many bytes are allocated while serving each request. The following chart shows how much memory a request to each endpoint allocates on average:
sort_desc(
  topk(
    10,
    sum by (route) (
      increase(hotpath_server_alloc_bytes_total[$__range])
    )
    /
    (
      sum by (route) (
        increase(hotpath_server_scoped_requests_total[$__range])
      ) > 0
    )
  )
)
If your app is using more memory than expected, this overview lets you quickly spot potential culprits. Endpoints allocating megabytes per request, e.g. by loading whole tables or large payloads into memory, are the first place to look.
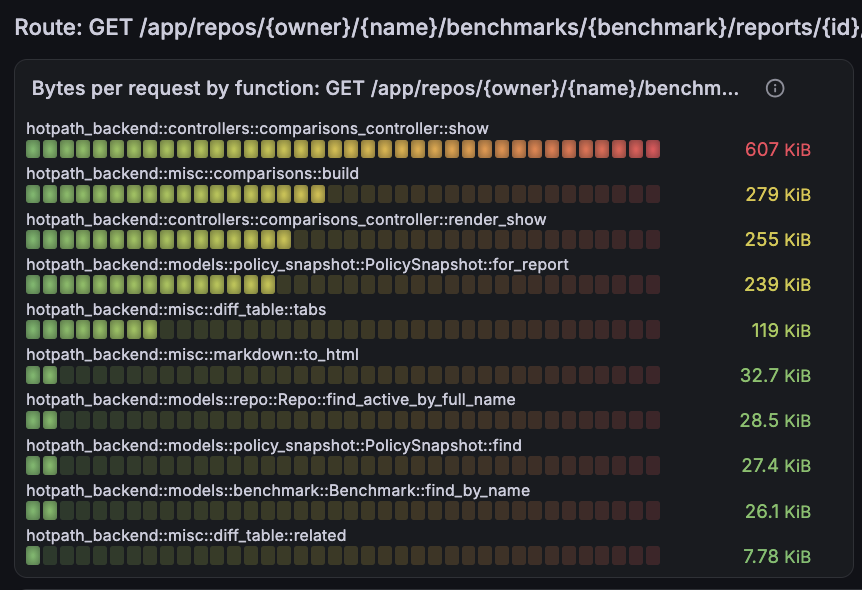
Once you’ve found a suspicious endpoint, you can narrow it down further. The following chart shows which instrumented functions contribute to its memory usage, measured as average bytes allocated per request:
sort_desc(
  topk(
    10,
    sum by (function) (
      increase(hotpath_function_route_alloc_bytes_total{route=~"$route"}[$__range])
    )
    /
    scalar(
      sum(
        increase(hotpath_server_scoped_requests_total{route=~"$route"}[$__range])
      )
    )
  )
)
By default, allocations are counted exclusively: each function reports only the memory it allocates itself, excluding nested instrumented calls. Here, comparisons_controller::show does not include the bytes allocated by comparisons::build and render_show, so each bar points directly to where the allocations happen. You can switch to cumulative accounting with HOTPATH_ALLOC_CUMULATIVE=true, but it double-counts recursive functions.
Timing details per request
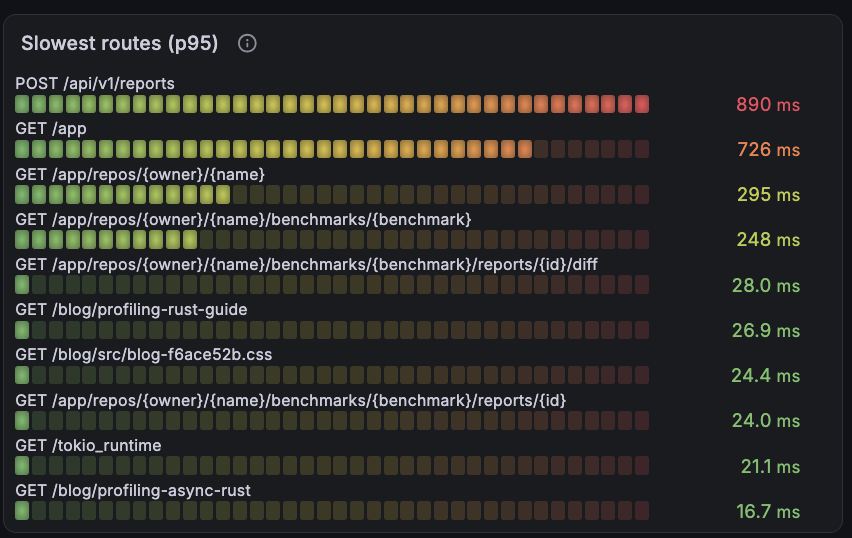
The same approach works for response times. Let’s start with the slowest endpoints, ranked by their p95 response time:
sort_desc(
  topk(
    10,
    histogram_quantile(
      0.95,
      sum by (route) (
        increase(hotpath_server_duration_seconds[$__range])
      )
    )
  )
)
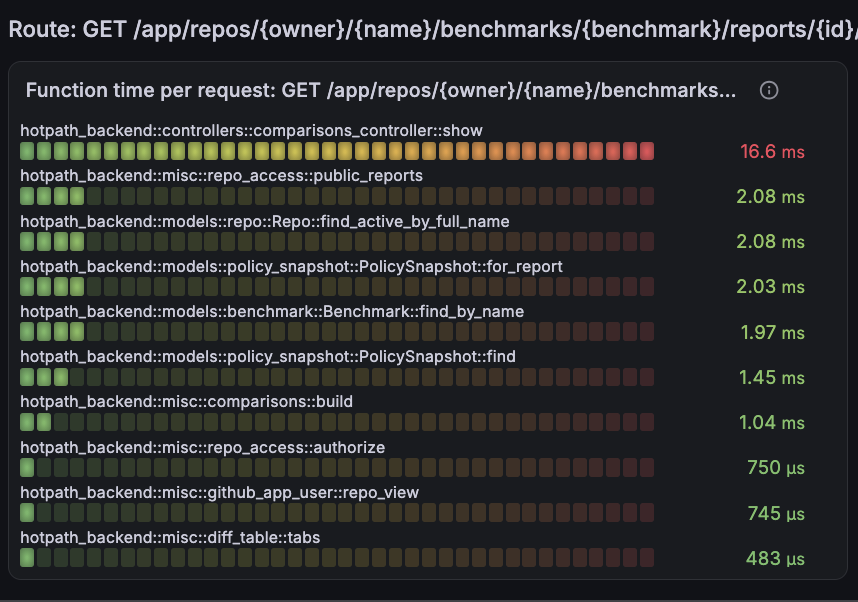
And for a selected endpoint, we can check which instrumented functions contribute to its response time, measured as average time spent per request:
sort_desc(
  topk(
    10,
    sum by (function) (
      increase(hotpath_function_route_duration_seconds_total{route=~"$route"}[$__range])
    )
    /
    (
      sum by (function) (
        increase(hotpath_function_route_timed_calls_total{route=~"$route"}[$__range])
      ) > 0
    )
    *
    sum by (function) (
      increase(hotpath_function_route_calls_total{route=~"$route"}[$__range])
    )
    /
    scalar(
      sum(
        increase(hotpath_server_scoped_requests_total{route=~"$route"}[$__range])
      )
    )
  )
)
Dividing by timed_calls and multiplying by calls keeps the numbers correct when time sampling is enabled.
Keep in mind that this timing data is inclusive. A function’s time includes time spent in all the instrumented functions it calls, so comparisons_controller::show above includes, for example, comparisons::build. Future releases of hotpath-rs will implement exclusive time attribution, showing only the time spent in each function’s own body.
Discovering slow channel processing in Rust
Channels are one of the primary ways Rust programs communicate across threads and often represent important data flows in your application. The hotpath::channel! macro lets you extract detailed performance metrics for any channel:
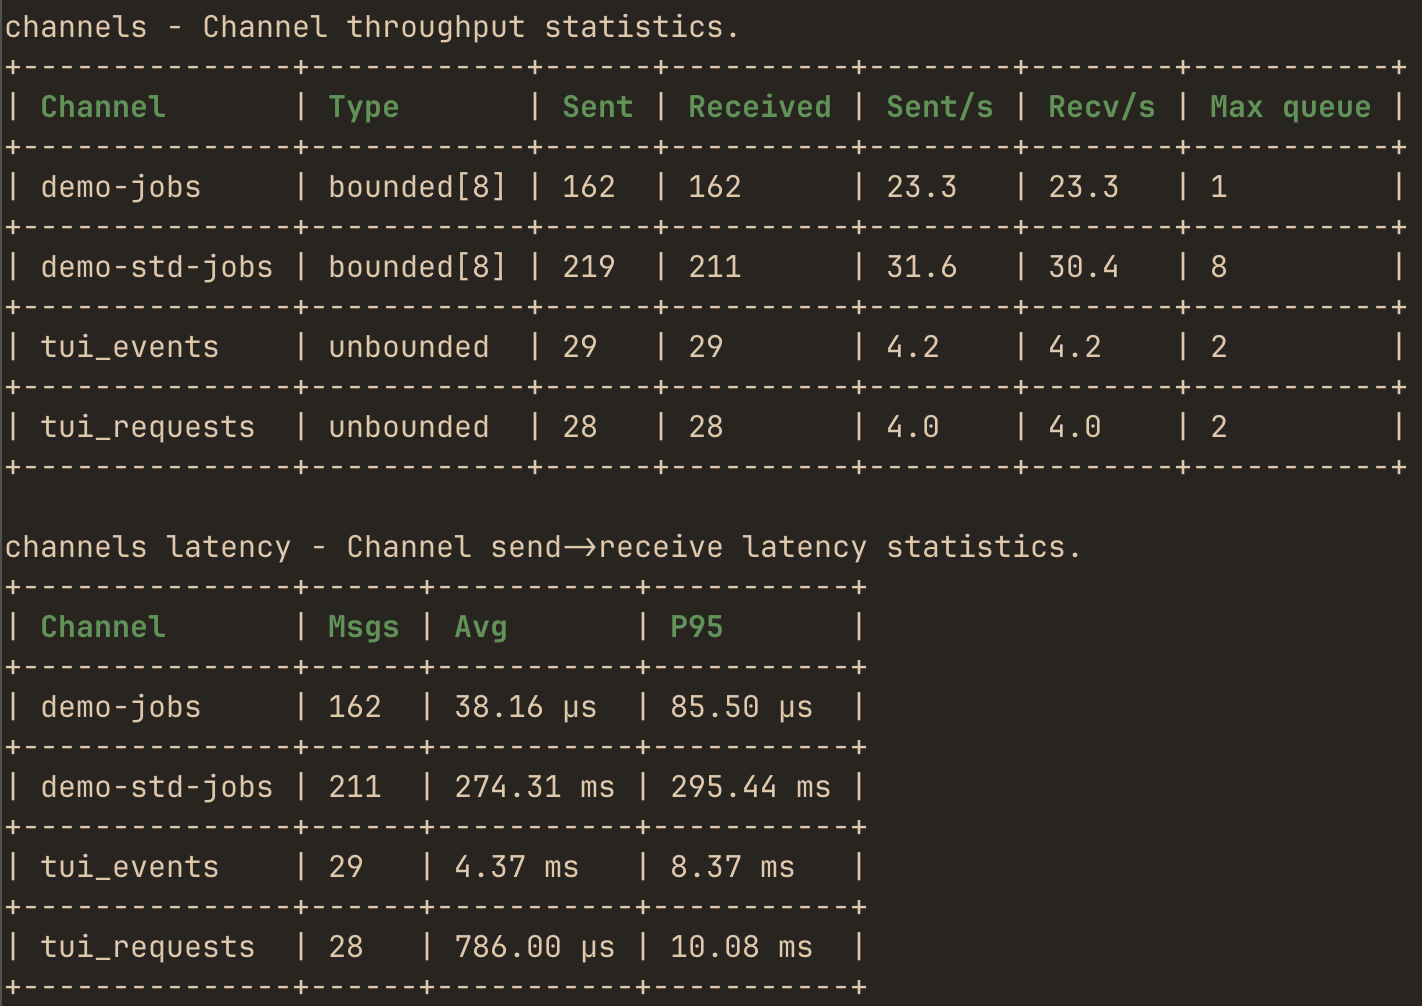
Arguably one of the most useful metrics here is the maximum queue size. A growing queue means that consumers are not keeping up with incoming messages, providing a strong signal of a bottleneck in your application’s processing pipeline.
hotpath-backend does not use any channels yet, so the following dashboard comes from the hotpath TUI demo. It shows the maximum queue size, throughput, and send-to-receive latency for each instrumented channel:
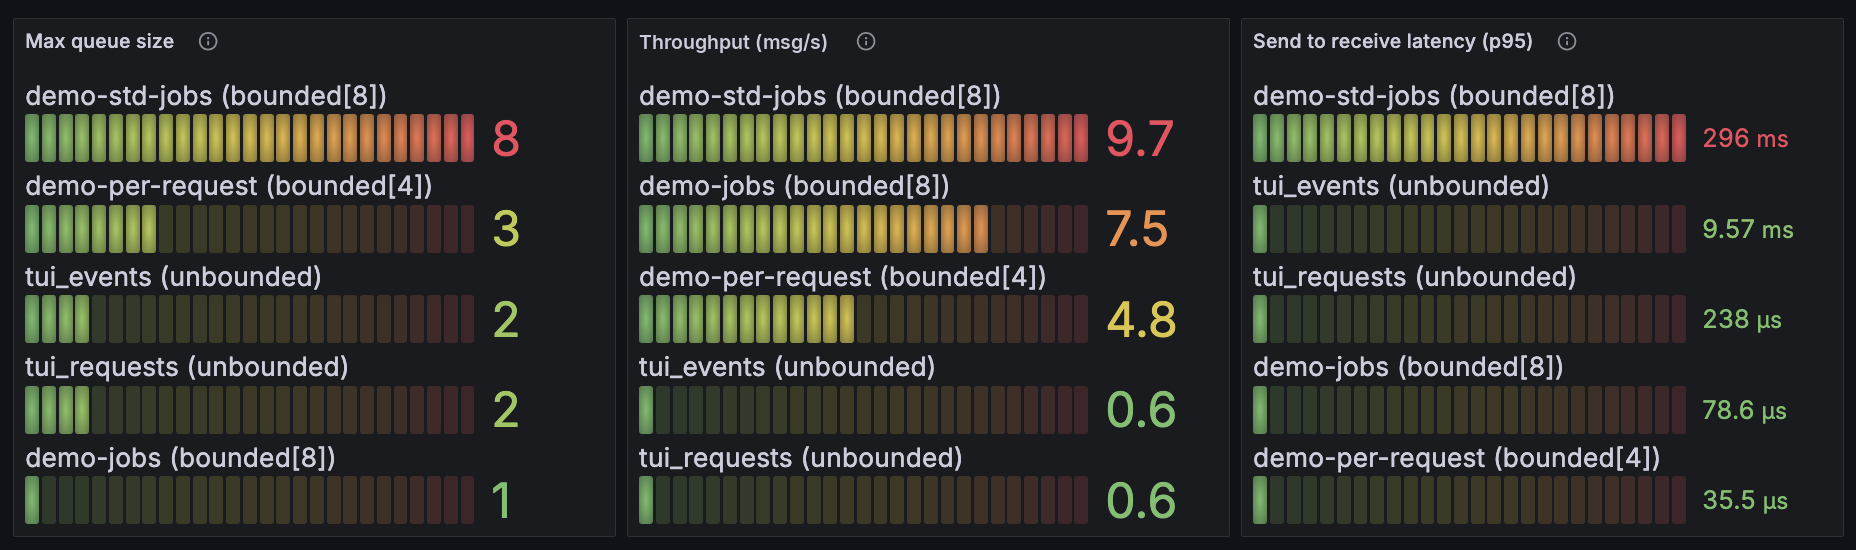
demo-std-jobs is a clear bottleneck here. Its queue reached the full capacity of 8 messages, causing senders to block while waiting for a free slot. It’s also the busiest channel, and messages spend 296ms in the queue before being received, while other channels deliver them within microseconds.
Maximum queue size since the process started, with channel capacity in the type label:
sort_desc(topk(10, max by (label, type) (hotpath_channel_max_queue_size)))
Throughput as messages received per second:
sort_desc(topk(10, sum by (label, type) (rate(hotpath_channel_received_total[$__range]))))
And p95 send-to-receive latency, measuring how long a message spends in the channel before being received:
sort_desc(
  topk(
    10,
    histogram_quantile(
      0.95,
      sum by (label, type) (
        increase(hotpath_channel_delay_seconds[$__range])
      )
    )
  )
)
I like this instrumentation mode because it’s useful regardless of the type of Rust application or your knowledge of the codebase. A queue that keeps growing under constant load is a strong signal of congestion or an inefficient consumer.
Lock contention
Similarly to channels, RwLocks and mutexes are commonly used to share data between threads. The hotpath::rw_lock! and hotpath::mutex! macros track two durations for every lock acquisition:
- wait time - how long a thread was blocked before the lock was acquired.
- hold time - how long the lock was held after it was acquired.
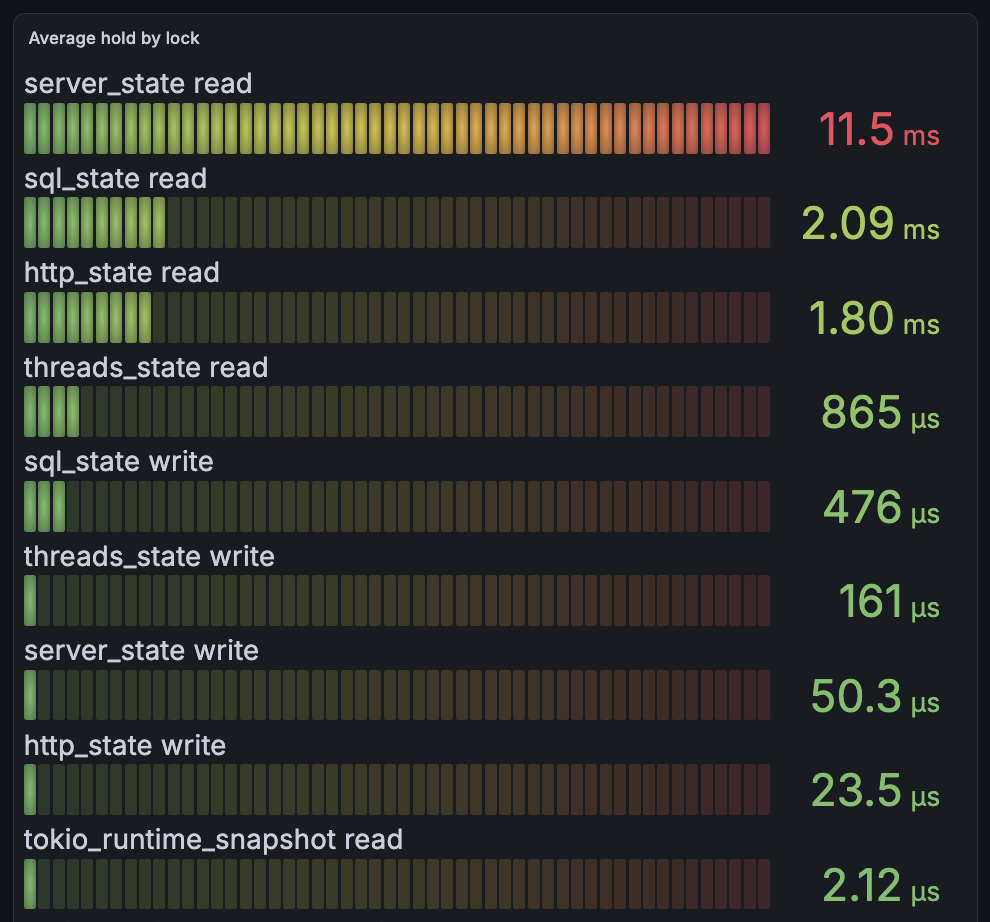
hotpath-backend does not use any instrumented locks itself, but hotpath-rs profiles its own internals the same way. The following chart comes from production and shows the average hold time for reads and writes of each RwLock guarding the profiler’s internal state:
sort_desc(
  topk(
    10,
    sum by (label, op) (
      histogram_sum(
        increase(hotpath_rwlock_acquire_seconds[$__range])
      )
    )
    /
    (
      sum by (label, op) (
        histogram_count(
          increase(hotpath_rwlock_acquire_seconds[$__range])
        )
      ) > 0
    )
  )
)
While working on this post, I’ve realized that reads of server_state hold the guard for over 10ms on average, several times longer than any other lock. That’s a sign of a too broad guard scope, e.g. doing expensive work like cloning or serializing data while the lock is still held. A read guard held that long blocks every writer in the meantime, so it’s something to look into.
A long hold time only becomes a real problem when other threads have to wait for the lock. To check that, chart the p95 wait time per lock and side:
sort_desc(
  topk(
    10,
    histogram_quantile(
      0.95,
      sum by (label, op) (
        increase(hotpath_rwlock_wait_seconds[$__range])
      )
    )
  )
)
A large wait time indicates that threads are competing for the same resource. Shortening the critical section, e.g. by preparing the new value before acquiring the lock, is a potential fix.
For mutexes use hotpath_mutex_wait_seconds and hotpath_mutex_acquire_seconds instead, without the op label.
Tokio runtime
Calling hotpath::tokio_runtime!() in your async main exposes live Tokio runtime metrics, so you can display per-worker stats in Grafana:

The table merges a separate query per column, each grouped by worker:
# Parks, Polls, Steals
sum by (worker) (increase(hotpath_tokio_worker_parks_total[$__range]))
sum by (worker) (increase(hotpath_tokio_worker_polls_total[$__range]))
sum by (worker) (increase(hotpath_tokio_worker_steals_total[$__range]))

# Busy, Busy %
sum by (worker) (increase(hotpath_tokio_worker_busy_seconds_total[$__range]))
sum by (worker) (rate(hotpath_tokio_worker_busy_seconds_total[$__range]))

# Local queue
sum by (worker) (hotpath_tokio_worker_local_queue_depth)

# Mean poll
sum by (worker) (increase(hotpath_tokio_worker_busy_seconds_total[$__range]))
/
(sum by (worker) (increase(hotpath_tokio_worker_polls_total[$__range])) > 0)
- Parks - how many times a worker went idle waiting for work.
- Busy - time a worker spent executing tasks, and its share of the selected time range.
- Polls - how many times a worker polled a task.
- Steals - tasks a worker took from other workers’ queues. Frequent stealing can suggest that work is not evenly distributed across workers.
- Local queue - tasks waiting in a worker’s queue. A queue that keeps growing may indicate that the worker is falling behind.
- Mean poll - busy time divided by polls, approximating how long a single poll takes. Long polls keep the worker from running other tasks.
If one worker stays much busier than the others, it may be worth checking for blocking calls or long-running tasks. Some of these metrics require building with RUSTFLAGS="--cfg tokio_unstable".
Per-thread CPU usage and memory allocations
Standard monitoring usually provides process-level CPU and memory usage metrics. hotpath-rs provides more granular insights by letting you observe individual threads. This means you can spot a single thread constantly spinning at 100% while others are sitting idle.
Thread monitoring is enabled by default, while per-thread allocation metrics require the hotpath-alloc feature. The following query shows the peak CPU usage reached by each thread since the process started:
sort_desc(topk(10, hotpath_thread_cpu_percent_max))
And this one, the total bytes allocated by each thread:
sort_desc(topk(10, hotpath_thread_alloc_bytes_total))
Put them side by side to build a similar dashboard:
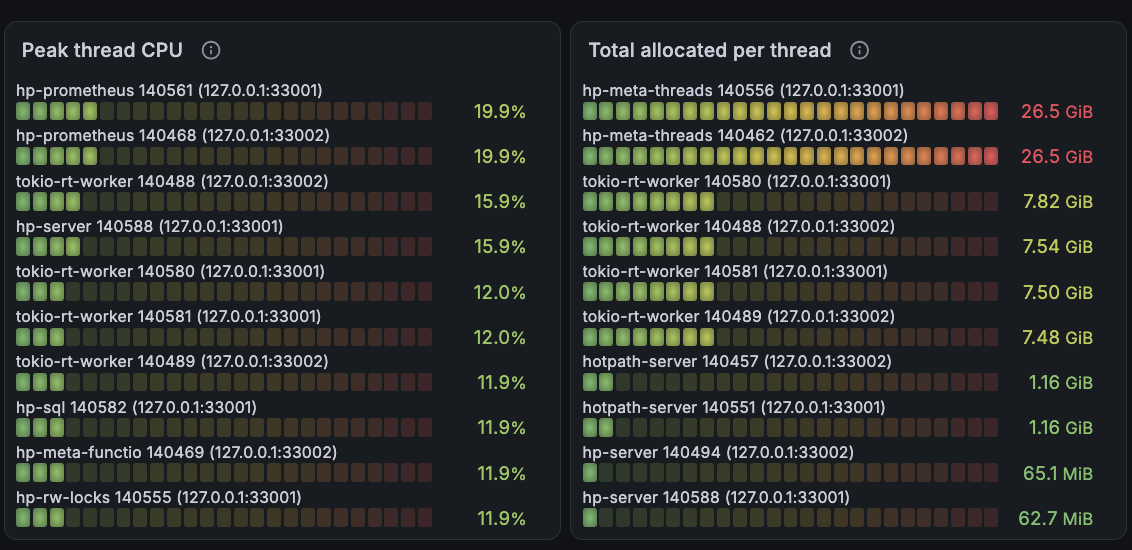
This provides a granular overview of which threads are doing most of the work and can help you spread the load more evenly when bottlenecks surface.
Both metrics are labeled with the thread name and OS tid, so give your threads names using std::thread::Builder::name. Otherwise, they will show up as generic thread_N.
To spot potential memory retention, compare allocated and deallocated bytes. If the difference keeps growing under a steady load, a thread may be holding on to memory:
rate(hotpath_thread_alloc_bytes_total[$__rate_interval])
- rate(hotpath_thread_dealloc_bytes_total[$__rate_interval])
Correlating app metrics with system-level signals
Host-level monitoring, e.g. node_exporter or your cloud provider’s metrics, can tell you that the CPU was maxed out or the network was saturated. It can’t tell you why.
That’s where the hotpath-rs Grafana integration really pays off. Its metrics are regular Prometheus series, so you can put them on the same dashboard, next to the CPU and network throughput charts coming from other sources. When the CPU chart spikes, you look at what your routes, SQL queries, and HTTP calls were doing at the same moment.
Being able to correlate signals across multiple app layers makes performance debugging a lot simpler.
How to minimize hotpath-rs profiling overhead impact?
Maybe the ideas above caught your attention, but you’re worried that adding such granular profiling will impact the performance of your production application. The good news is that there’s a simple way to verify that the profiling overhead stays negligible.
#[hotpath::measure] adds around 40ns per call (see profiling overhead docs), which I’ll round up to 50ns. That’s 0.001% for a 5ms function, but 10% for a 500ns one. Fast functions only matter if they account for a meaningful share of total execution time, so the following query filters on both:
sort_desc(
  (
    100 * ($overhead_ns * 1e-9) / (
      sum by (function) (histogram_sum(increase(hotpath_function_duration_seconds[$__range])))
      /
      (sum by (function) (histogram_count(increase(hotpath_function_duration_seconds[$__range]))) > 0)
    )
    > $threshold
  )
  and on (function)
  (
    100 * sum by (function) (histogram_sum(increase(hotpath_function_duration_seconds[$__range])))
    /
    scalar(sum(histogram_sum(increase(hotpath_function_duration_seconds[$__range]))))
    > $min_share
  )
)
The first part divides $overhead_ns by each function’s average call duration and keeps only functions above $threshold. The second keeps only functions that account for more than $min_share of the total instrumented time. All three values are Grafana textbox variables you can tweak directly from the dashboard.
For the hotpath-backend binary running this blog, a 1% time share and 1% overhead threshold return no results. I had to lower them to 0.1% and 0.01% respectively to get anything to show up:
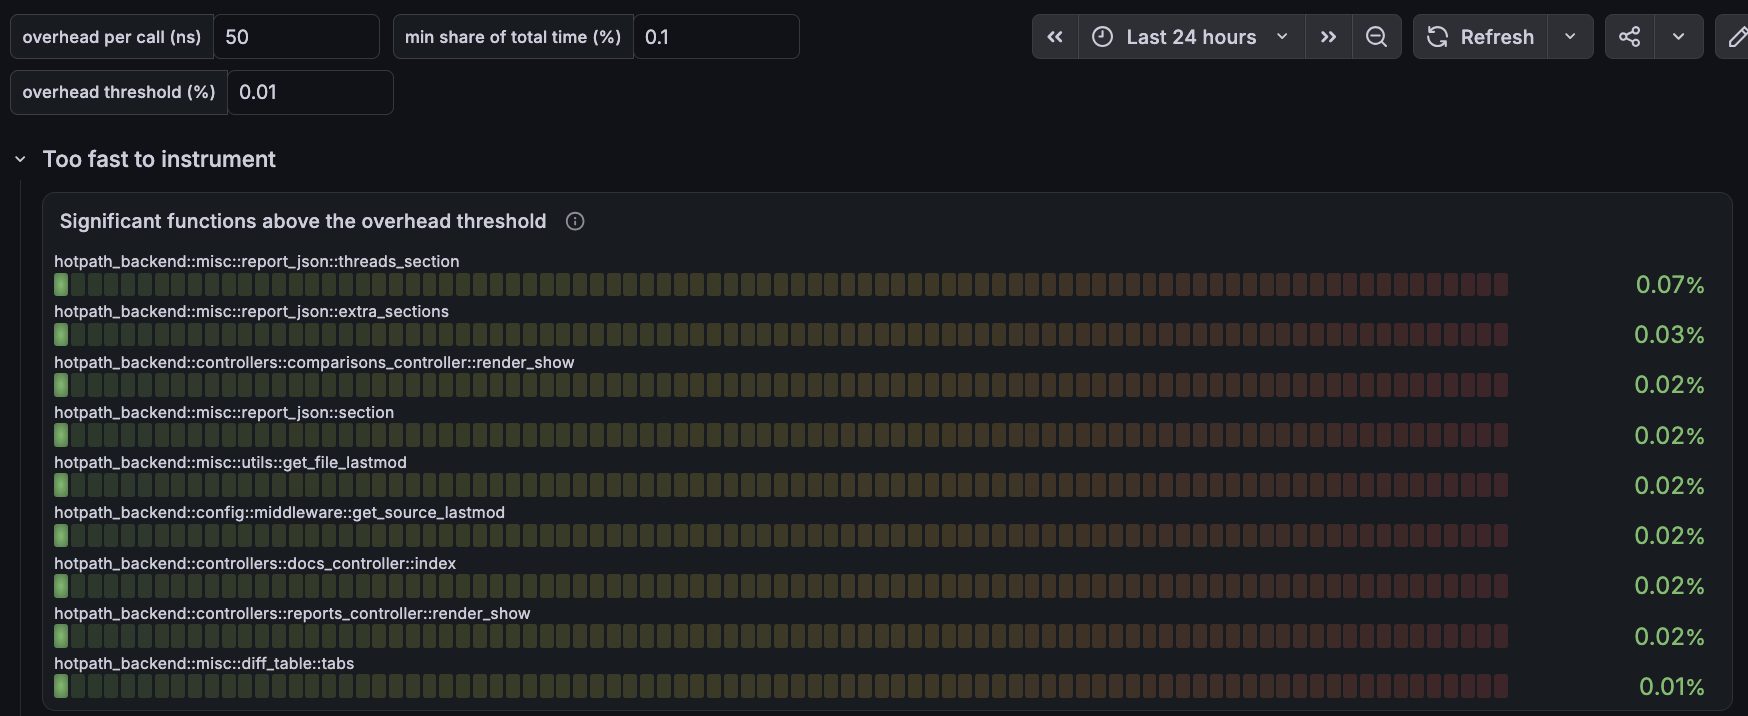
The worst one is at 0.07%. Without the share filter, functions like report_json::futures_section reach 13-16% overhead, but each accounts for less than 0.01% of total execution time, so their impact is negligible.
Disclaimer: hotpath-backend currently serves minimal traffic, so these numbers will differ for busier Rust applications. But the technique stays the same, letting you verify that profiling overhead remains negligible even in high-traffic production deployments.
Get started with hotpath-rs Grafana using an AI skill
While working on this post, I considered providing ready-to-use Grafana dashboard templates. But since we’re in the AI era now, I think a more user-friendly way to share the setup is through an AI skill. I’ve updated the hotpath CLI to include a Grafana init command:
cargo install hotpath --version '^0.28'
hotpath init-grafana --agent claude # or --agent codex / --agent opencode
This command launches your own agent session with a skill containing everything it needs to configure a dedicated hotpath-rs Grafana dashboard for your project. Give it a try, and let me know in the comments if you manage to find any actionable insights.
Use hotpath Cloud to spot issues before they reach production
Production observability is great, but it’s even better to catch performance issues before they get deployed. hotpath Cloud lets you observe the same context-aware metrics in your CI benchmarks and put regression constraints and performance budgets on them.
For example, the N+1 check from the SQL section can become a hard limit enforced on every pull request:
# hotpath/policy.toml
[[server.budgets]]
match = "*"
timing = { sql_per_request = 5 }
message = "too many SQL queries per request, check for N+1 calls"
or you can ensure that a specific hot function never allocates:
[[functions.budgets]]
match = "my_crate::router::route"
alloc = { total = "0 B" }
message = "route() is on the hot path and must not allocate"
Each pull request gets a comment summarizing meaningful performance changes, so regressions are caught in review instead of on a Grafana dashboard:
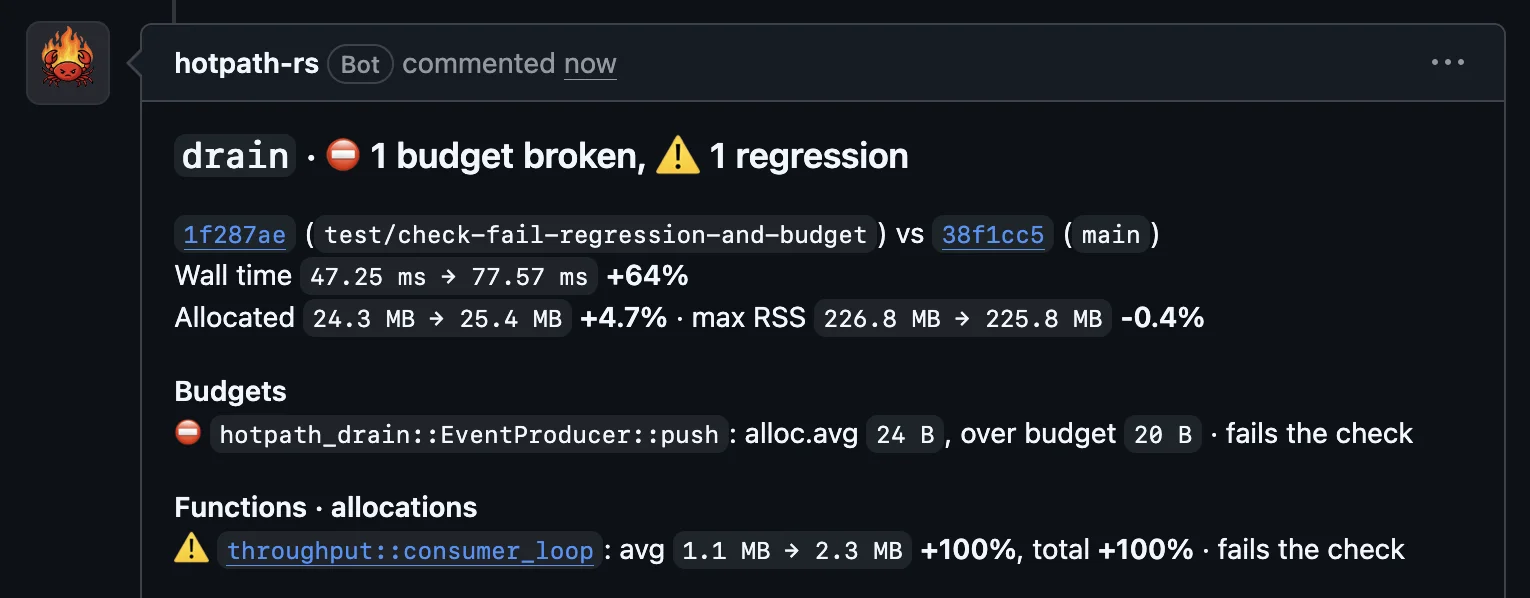
You can set it up with your AI agent in a few minutes:
cargo install hotpath
hotpath init-ci --agent claude # or --agent codex / --agent opencode
With AI agents writing more and more code, manually reviewing every change for its performance impact no longer scales. hotpath Cloud adds deterministic constraints to your CI pipeline: regression limits and performance budgets that every pull request must pass, regardless of whether it was written by a human or an agent. This ensures your application stays performant even as the pace of changes keeps growing.
hotpath Cloud is now in open beta and free to use, so give it a try! After beta it will remain free for public repositories. I’ll elaborate on how to use it in the next post, so follow me on X to get notified when it’s out.
Summary
hotpath-rs exposes performance metrics that are difficult to get from traditional observability tooling. These include SQL queries, HTTP calls, and allocations attributed to the exact Axum endpoint, as well as per-channel and per-lock latency. The real value comes from combining these signals with application context, making them easier to reason about and act on.
I dogfood hotpath-rs extensively, using it to profile both the hotpath Cloud backend and the profiler itself. I’ll keep refining the production workflows and dashboards as I learn what works best.
I invite you to check out hotpath-rs and integrate it into your Grafana setup. If you build a dashboard worth sharing, or if there’s a performance metric you’re missing from the lib, I’d love to hear from you.