Prometheus and Grafana integration
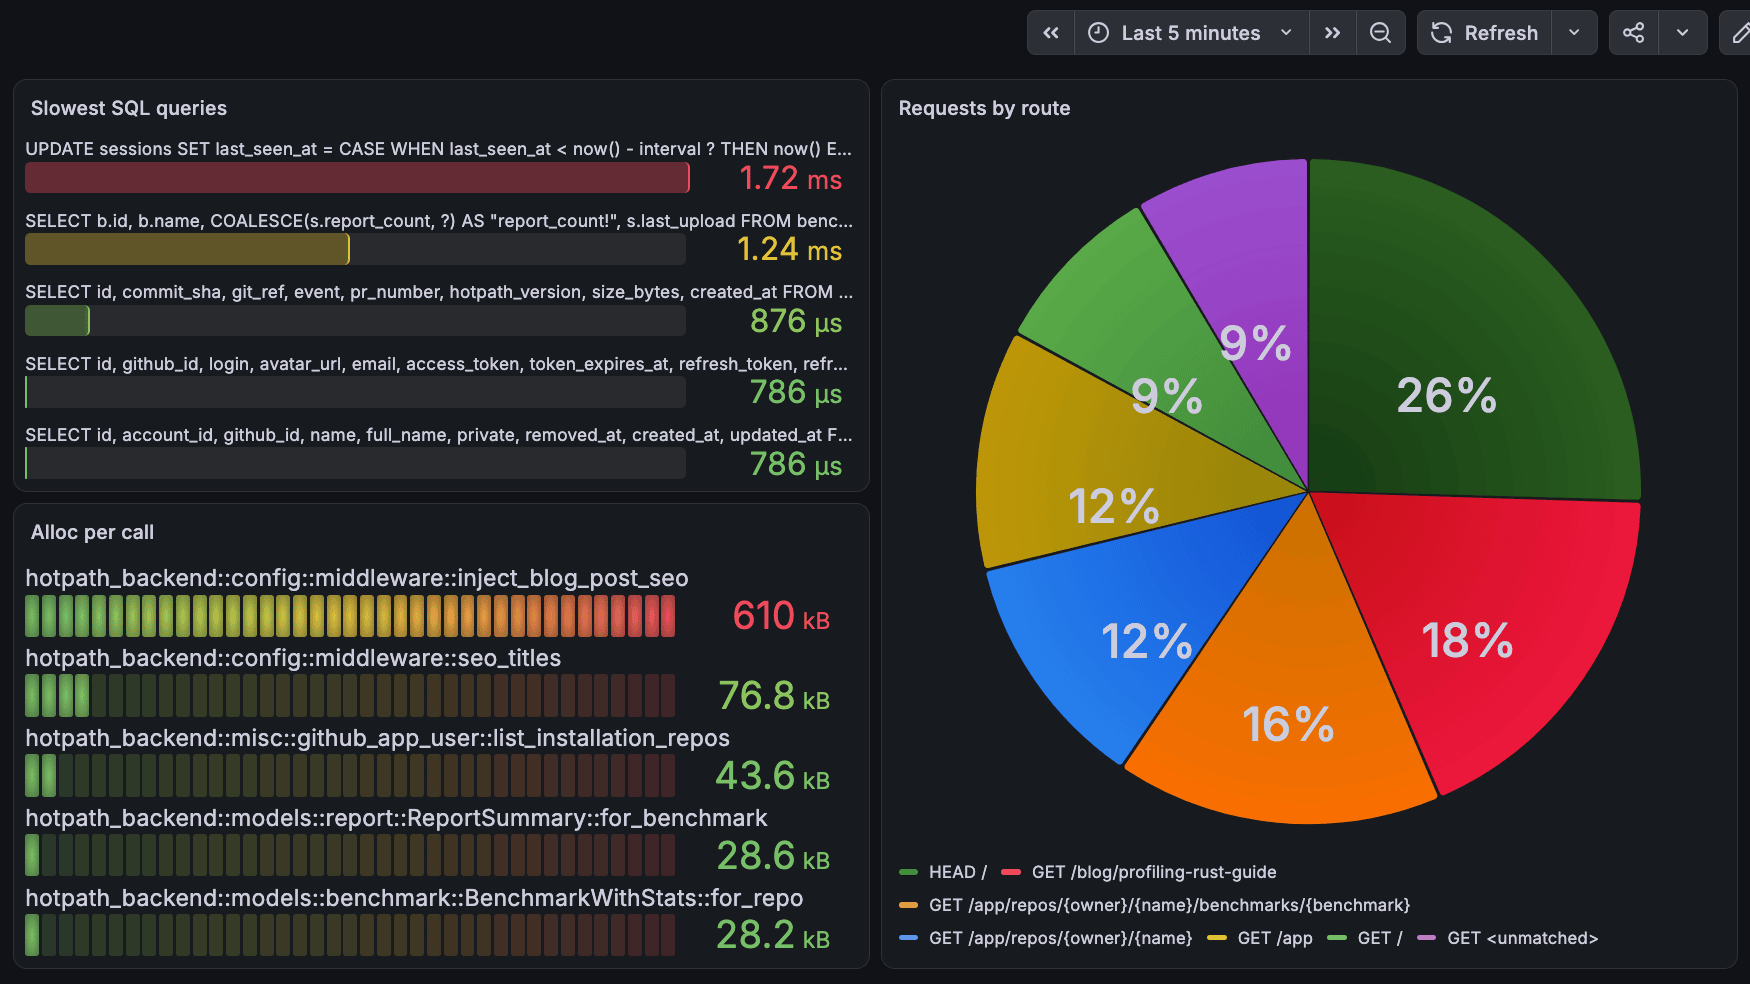
The hotpath-prometheus feature exposes every profiling subsystem as Prometheus metrics on a dedicated GET /metrics endpoint. Point a Prometheus scraper at it and build Grafana dashboards on top of any of the performance signals measured by the library.
AI setup
The quickest way to build a Grafana dashboard for your app is to let your own AI coding agent do it. Install the hotpath CLI and run init-grafana inside your project repo:
cargo install hotpath --version '^0.28'
hotpath init-grafana --agent claude # or --agent codex / --agent opencode
hotpath init-grafana downloads the hotpath_init_grafana agent skill from GitHub and starts your installed Claude Code, Codex or OpenCode with it as setup instructions. The agent builds a dashboard JSON file with panels for the subsystems your app instruments: SQL and HTTP time per route, N+1 detection, memory and time per request, channel queues, lock contention, Tokio workers, per-thread CPU and profiling overhead. It only writes the dashboard: configure the metrics endpoint and Prometheus scrape job as described below, then import the file into Grafana.
Configure prometheus metrics endpoint
Add hotpath-prometheus feature forwarding:
[dependencies]
hotpath = "0.28"

[features]
hotpath = ["hotpath/hotpath"]
hotpath-alloc = ["hotpath/hotpath-alloc"]
hotpath-prometheus = ["hotpath/hotpath-prometheus"]
cargo run --features='hotpath,hotpath-prometheus'
The exporter starts automatically with the profiler on 127.0.0.1:6772 (customizable with HOTPATH_PROMETHEUS_PORT, HOTPATH_PROMETHEUS_HOST). Verify it with:
curl http://127.0.0.1:6772/metrics
Prometheus scrape config
Minimal prometheus.yml:
global:
  scrape_interval: 5s

scrape_configs:
  - job_name: hotpath
    scrape_native_histograms: true
    static_configs:
      - targets: ["127.0.0.1:6772"]
With scrape_native_histograms: true Prometheus negotiates the protobuf format and ingests high-resolution native histograms. Without it, the exporter serves the text format with coarse classic buckets.
The two representations are queried differently. A native histogram is a single series under the bare metric name, e.g. hotpath_function_duration_seconds. A classic histogram is a set of float series with the _bucket, _sum and _count suffixes. When Prometheus ingests the native part, it drops the classic part, so the suffixed series do not exist. Add always_scrape_classic_histograms: true to the scrape config to store both.
Authentication
Set HOTPATH_PROMETHEUS_AUTH_TOKEN and every request must carry it in the Authorization header, either bare or Bearer-prefixed. This matches Prometheus’ authorization scrape config:
global:
  scrape_interval: 5s

scrape_configs:
  - job_name: hotpath
    scrape_native_histograms: true
    authorization:
      credentials: your-secret-token
    static_configs:
      - targets: ["127.0.0.1:6772"]
The token travels in plaintext: it guards against other local processes and accidental exposure, not a substitute for TLS.
Grafana
Add Prometheus as a data source and query the metrics with PromQL. The histogram queries below assume native histograms (the scrape_native_histograms: true config above); the classic equivalents follow.
# p99 function duration
histogram_quantile(0.99, sum by (function) (rate(hotpath_function_duration_seconds[1m])))

# Average function duration
histogram_sum(rate(hotpath_function_duration_seconds[1m])) / histogram_count(rate(hotpath_function_duration_seconds[1m]))

# Calls per second per function
rate(hotpath_function_calls_total[1m])

# Allocation rate per function
rate(hotpath_function_alloc_bytes_total[1m])

# SQL queries per served request, per route
rate(hotpath_server_sql_calls_total[5m]) / rate(hotpath_server_scoped_requests_total[5m])

# I/O throughput that stays correct under time sampling
rate(hotpath_io_sampled_bytes_total[1m]) / histogram_sum(rate(hotpath_io_op_seconds[1m]))

# Average future poll duration
rate(hotpath_future_poll_seconds_total[1m]) / rate(hotpath_future_sampled_polls_total[1m])
Durations are exported in seconds. Counters are cumulative since profiling started, so use rate() / increase() in queries.
Classic histogram queries
Without scrape_native_histograms (or with always_scrape_classic_histograms: true) histograms are stored as _bucket, _sum and _count series. Quantiles need the le label and the _bucket suffix, and sums and counts are plain series instead of histogram_sum() / histogram_count():
# p99 function duration
histogram_quantile(0.99, sum by (function, le) (rate(hotpath_function_duration_seconds_bucket[1m])))

# Average function duration
rate(hotpath_function_duration_seconds_sum[1m]) / rate(hotpath_function_duration_seconds_count[1m])

# I/O throughput that stays correct under time sampling
rate(hotpath_io_sampled_bytes_total[1m]) / rate(hotpath_io_op_seconds_sum[1m])
Classic buckets are coarse, log-spaced 1-3 steps, so quantiles from them are rough estimates. Prefer native histograms when accuracy matters.
Two bucket ladders are used. The fast ladder (250ns to 10s) covers function, lock, channel, future and I/O durations. The slow ladder (100µs to 60s) covers SQL queries, outbound HTTP requests and server responses. Both can be customized with HOTPATH_PROMETHEUS_FAST_BUCKETS / HOTPATH_PROMETHEUS_SLOW_BUCKETS: a comma-separated list of upper bounds in seconds, strictly ascending, e.g. 0.000001,0.00002,0.001,0.1. The +Inf bucket is always appended. Invalid input panics at startup. Changing the ladder starts new _bucket series, so keep it stable across deployments.
Time sampling
With time sampling enabled, *_total call counters still count every call, while duration histograms only contain the sampled ones. Their count (histogram_count(), or the classic _count series) is the number of timed calls, so averages derived from sum / count stay correct.
Available metrics
Families with no data are omitted from the scrape, e.g. lock metrics appear only when a mutex! or rw_lock! wrapper has been used.
Process
| Metric | Type | Labels | Description |
|---|---|---|---|
hotpath_build_info | gauge | hotpath_version, rustc_version, profile, os | Always 1, build metadata lives in the labels |
hotpath_uptime_seconds | gauge | Seconds since profiling started |
hotpath_build_info describes the binary that produced the scrape:
hotpath_build_info{hotpath_version="0.24.0",rustc_version="1.97.0",profile="release",os="linux-x86_64"} 1
hotpath_version/rustc_version- crate and compiler versions the binary was built with.profile- the Cargo profile the binary was built with:debug,release, or a custom profile’s name such asprofiling.os-OS-ARCHpair of the running process, e.g.linux-x86_64ormacos-aarch64.
Functions
Requires #[hotpath::measure] / #[hotpath::measure_all] instrumentation.
| Metric | Type | Labels | Description |
|---|---|---|---|
hotpath_function_calls_total | counter | function | Total calls, including calls skipped by time sampling |
hotpath_function_duration_seconds | histogram | function | Duration of sampled calls |
With the hotpath-alloc feature:
| Metric | Type | Labels | Description |
|---|---|---|---|
hotpath_function_alloc_bytes_total | counter | function | Total bytes allocated |
hotpath_function_alloc_count_total | counter | function | Total allocations |
hotpath_function_alloc_bytes | histogram | function | Bytes allocated per call |
hotpath_function_alloc_count | histogram | function | Allocations per call |
The two per-call histograms are omitted for async entries whose measurements carry no per-call totals.
With the axum layer installed, calls made under a route scope are additionally split by route (running totals only, no per-route histograms), which answers “which functions does this endpoint spend its time and memory in”:
| Metric | Type | Labels | Description |
|---|---|---|---|
hotpath_function_route_calls_total | counter | function, route | Calls made under each route |
hotpath_function_route_timed_calls_total | counter | function, route | Route-scoped calls that carried a duration (time sampling) |
hotpath_function_route_duration_seconds_total | counter | function, route | Time spent in the function under each route, over timed calls |
hotpath_function_route_alloc_bytes_total | counter | function, route | Bytes allocated by the function under each route (hotpath-alloc) |
hotpath_function_route_alloc_count_total | counter | function, route | Allocations made by the function under each route (hotpath-alloc) |
Calls outside any route scope are only in the per-function families above. Divide by hotpath_function_route_timed_calls_total (time) or hotpath_function_route_calls_total (memory) for per-call averages, e.g. the functions a route allocates the most in:
topk(10, sum by (function) (increase(hotpath_function_route_alloc_bytes_total{route="GET /users/{id}"}[1h])))
SQL queries
Requires a SQL tracing integration. Series are keyed by normalized query text; queries longer than HOTPATH_MAX_LOG_LEN are truncated with a hash suffix so distinct queries never collapse into one series.
| Metric | Type | Labels | Description |
|---|---|---|---|
hotpath_sql_queries_total | counter | query, source, route | Total executions |
hotpath_sql_duration_seconds | histogram | query, source, route | Query duration |
source is the innermost instrumented caller, route the axum route handling the request (see route scoping). Aggregate with sum by (query) for the per-query view.
HTTP client requests
Requires hotpath::http!(client).
| Metric | Type | Labels | Description |
|---|---|---|---|
hotpath_http_requests_total | counter | endpoint, source, route | Total outbound requests per normalized endpoint |
hotpath_http_errors_total | counter | endpoint, source, route | Transport errors plus responses with status >= 400 |
hotpath_http_duration_seconds | histogram | endpoint, source, route | Request duration |
HTTP server (axum)
Requires hotpath::axum!(router).
| Metric | Type | Labels | Description |
|---|---|---|---|
hotpath_server_requests_total | counter | route | Total requests per matched route template |
hotpath_server_responses_total | counter | route, class | Responses with a 4xx or 5xx status |
hotpath_server_duration_seconds | histogram | route | Duration until the response head is produced |
hotpath_server_scoped_requests_total | counter | route | Completed requests that carried a route scope |
hotpath_server_sql_calls_total | counter | route | SQL queries issued by route-scoped requests |
hotpath_server_http_calls_total | counter | route | Outbound HTTP requests issued by route-scoped requests |
hotpath_server_alloc_bytes_total | counter | route | Bytes allocated by route-scoped requests (hotpath-alloc) |
hotpath_server_alloc_count_total | counter | route | Allocations made by route-scoped requests (hotpath-alloc) |
hotpath_server_alloc_bytes | histogram | route | Bytes allocated per route-scoped request (hotpath-alloc) |
Divide the SQL, HTTP and allocation counters by hotpath_server_scoped_requests_total for per-request rates; hotpath_server_alloc_bytes gives per-request memory percentiles with histogram_quantile.
Locks
Requires hotpath::mutex! / hotpath::rw_lock! wrappers. Call-site labels: source is the file:line:column of the wrapper macro, label the user-provided label (empty when unset), iter the instantiation index for call sites that create several instances.
| Metric | Type | Labels | Description |
|---|---|---|---|
hotpath_mutex_acquisitions_total | counter | source, label, iter | Total acquisitions, including those skipped by time sampling |
hotpath_mutex_wait_seconds | histogram | source, label, iter | Time spent waiting to acquire |
hotpath_mutex_acquire_seconds | histogram | source, label, iter | Time the lock was held |
hotpath_rwlock_acquisitions_total | counter | source, label, iter, op | Total acquisitions per side (op = read / write) |
hotpath_rwlock_wait_seconds | histogram | source, label, iter, op | Time spent waiting to acquire, per side |
hotpath_rwlock_acquire_seconds | histogram | source, label, iter, op | Time the lock was held, per side |
Channels
Requires hotpath::channel! wrappers. type is the channel kind (bounded[N], unbounded, oneshot), payload the message type name.
| Metric | Type | Labels | Description |
|---|---|---|---|
hotpath_channel_sent_total | counter | source, label, iter, type, payload | Messages sent |
hotpath_channel_received_total | counter | source, label, iter, type, payload | Messages received |
hotpath_channel_instances_created_total | counter | source, label, iter, type, payload | Instances created at this call site since start |
hotpath_channel_instances_closed_total | counter | source, label, iter, type, payload | Instances that have closed |
hotpath_channel_queue_size | gauge | source, label, iter, type, payload | Messages sent but not yet received |
hotpath_channel_max_queue_size | gauge | source, label, iter, type, payload | Since-start high-water mark of the queue size |
hotpath_channel_delay_seconds | histogram | source, label, iter, type, payload | Delay between send and sampled receive |
Streams
Requires hotpath::stream! wrappers.
| Metric | Type | Labels | Description |
|---|---|---|---|
hotpath_stream_items_total | counter | source, label, iter, payload | Items yielded |
hotpath_stream_instances_created_total | counter | source, label, iter, payload | Instances created at this call site since start |
hotpath_stream_instances_closed_total | counter | source, label, iter, payload | Instances that have closed |
Subtract the closed counter from the created one for the number of instances currently alive at a call site.
Futures
Requires #[hotpath::measure(future = true)] or #[hotpath::future_fn] on the async function, or a hotpath::future! wrapper. source is the function path for the attribute macros and the file:line:column call site for future!.
| Metric | Type | Labels | Description |
|---|---|---|---|
hotpath_future_polls_total | counter | source, label | Total polls, including polls skipped by time sampling |
hotpath_future_sampled_polls_total | counter | source, label | Timed polls, the denominator for the average poll duration |
hotpath_future_poll_seconds_total | counter | source, label | Time spent in timed polls |
hotpath_future_poll_alloc_bytes_total | counter | source, label | Bytes allocated during polls (requires hotpath-alloc) |
hotpath_future_poll_allocs_total | counter | source, label | Allocations during polls (requires hotpath-alloc) |
I/O
Requires hotpath::io! wrappers. type is the wrapped type name, op one of read, write, flush, shutdown. Op kinds a wrapper never touched are not exported.
| Metric | Type | Labels | Description |
|---|---|---|---|
hotpath_io_ops_total | counter | source, label, iter, type, op | Total operations, including ops skipped by time sampling |
hotpath_io_bytes_total | counter | source, label, iter, type, op | Total bytes transferred |
hotpath_io_sampled_bytes_total | counter | source, label, iter, type, op | Bytes transferred by timed operations |
hotpath_io_errors_total | counter | source, label, iter, type, op | Operations that returned an error |
hotpath_io_op_seconds | histogram | source, label, iter, type, op | Duration of sampled operations |
Threads
Requires the threads feature. Per-thread series cover live threads only; a thread’s series goes stale after it exits, while its allocations stay in the process-level totals.
| Metric | Type | Labels | Description |
|---|---|---|---|
hotpath_threads | gauge | Threads in the most recent monitor sample | |
hotpath_rss_bytes | gauge | Resident set size of the process | |
hotpath_thread_cpu_percent | gauge | name, tid | CPU usage over the last monitor interval |
hotpath_thread_cpu_percent_max | gauge | name, tid | Since-start peak CPU usage |
hotpath_thread_cpu_percent_avg | gauge | name, tid | Lifetime average CPU usage |
hotpath_thread_cpu_seconds_total | counter | name, tid, mode | CPU time per thread (mode = user / sys) |
hotpath_thread_alloc_bytes_total | counter | name, tid | Bytes allocated per thread (requires hotpath-alloc) |
hotpath_thread_dealloc_bytes_total | counter | name, tid | Bytes deallocated per thread (requires hotpath-alloc) |
hotpath_alloc_bytes_total | counter | Bytes allocated by the process, exited threads included (requires hotpath-alloc) | |
hotpath_dealloc_bytes_total | counter | Bytes deallocated by the process, exited threads included (requires hotpath-alloc) |
Tokio runtime
Requires the tokio feature and hotpath::tokio_runtime!(). Some series are only available when Tokio’s unstable (RUSTFLAGS="--cfg tokio_unstable") metrics are enabled.
| Metric | Type | Labels | Description |
|---|---|---|---|
hotpath_tokio_workers | gauge | Worker threads | |
hotpath_tokio_alive_tasks | gauge | Tasks currently alive | |
hotpath_tokio_global_queue_depth | gauge | Tasks waiting in the global injection queue | |
hotpath_tokio_blocking_threads | gauge | Threads in the blocking pool | |
hotpath_tokio_idle_blocking_threads | gauge | Idle threads in the blocking pool | |
hotpath_tokio_blocking_queue_depth | gauge | Tasks waiting for the blocking pool | |
hotpath_tokio_spawned_tasks_total | counter | Tasks spawned since start | |
hotpath_tokio_remote_schedules_total | counter | Tasks scheduled from outside the runtime | |
hotpath_tokio_io_fd_registered_total | counter | File descriptors registered with the io driver | |
hotpath_tokio_io_fd_deregistered_total | counter | File descriptors deregistered from the io driver | |
hotpath_tokio_io_ready_events_total | counter | Readiness events delivered by the io driver | |
hotpath_tokio_worker_parks_total | counter | worker | Times each worker parked |
hotpath_tokio_worker_busy_seconds_total | counter | worker | Time each worker spent executing tasks |
hotpath_tokio_worker_polls_total | counter | worker | Tasks polled by each worker |
hotpath_tokio_worker_steals_total | counter | worker | Tasks stolen from other workers’ queues |
hotpath_tokio_worker_local_queue_depth | gauge | worker | Tasks waiting in each worker’s local queue |
Gauges
Requires hotpath::gauge! entries.
| Metric | Type | Labels | Description |
|---|---|---|---|
hotpath_gauge | gauge | key | Current value |
hotpath_gauge_min | gauge | key | Since-start minimum |
hotpath_gauge_max | gauge | key | Since-start maximum |
hotpath_gauge_updates_total | counter | key | Updates applied |
Configuration
| Environment Variable | Default | Description |
|---|---|---|
HOTPATH_PROMETHEUS_PORT | 6772 | Port the exporter listens on |
HOTPATH_PROMETHEUS_HOST | 127.0.0.1 | Bind address; set to 0.0.0.0 when a Prometheus container must reach the exporter through the Docker bridge |
HOTPATH_PROMETHEUS_AUTH_TOKEN | - | Optional token required in the Authorization header, bare or Bearer-prefixed |
HOTPATH_PROMETHEUS_FAST_BUCKETS | 250ns .. 10s | Classic bucket bounds in seconds for function, lock, channel, future and I/O histograms, comma-separated and strictly ascending, see classic histogram queries |
HOTPATH_PROMETHEUS_SLOW_BUCKETS | 100µs .. 60s | Classic bucket bounds in seconds for SQL, HTTP client and server histograms, same format |
Example:
HOTPATH_PROMETHEUS_PORT=9100 HOTPATH_PROMETHEUS_AUTH_TOKEN=secret123 \
cargo run --features='hotpath,hotpath-prometheus'