Monitor File, Socket and Async I/O Streams in Rust
hotpath instruments byte-level I/O to surface slow reads and writes - files, sockets, TLS streams, TCP connections like Redis, compression streams, and custom I/O types.
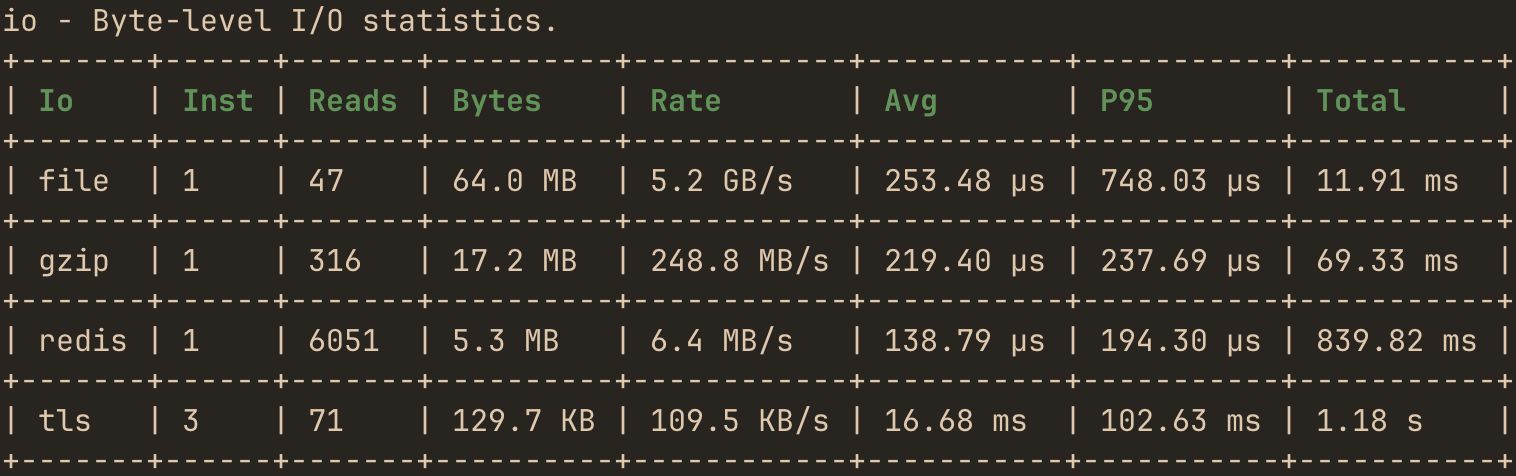
- Operation count - completed operations
- Bytes processed - total bytes read or written
- Rate - per-operation transfer speed: bytes divided by summed in-flight operation time, waiting included
- Duration - average and configured percentiles. Synchronous operations measure the full method call; async operations measure from the first poll to
Ready, so reported durations include async waiting time (e.g. waiting for a socket to become readable), not only the final poll execution. - Errors - failed operations. Retryable conditions (
WouldBlock,Interrupted) are not counted as errors and produce no operation.
The io! macro is noop unless the hotpath feature is activated.
The I/O section of the Rust profiling guide uses this report to find a misconfigured Brotli encoder in maplibre/martin.
io! macro
Wrap any value implementing std::io::Read, std::io::Write, tokio::io::AsyncRead, or tokio::io::AsyncWrite (async traits require the tokio feature). The wrapper delegates every operation to the wrapped value, so it is a drop-in replacement.
Profiling file read operation:
use std::io::Read;

let mut file = hotpath::io!(std::fs::File::open("data.bin")?, label = "data-file");
let mut buf = Vec::new();
file.read_to_end(&mut buf)?;
See the basic_io_sync and basic_io_async examples.
Profiling Redis TCP connection:
use tokio::io::{AsyncReadExt, AsyncWriteExt};

let stream = tokio::net::TcpStream::connect("127.0.0.1:6379").await?;
let mut stream = hotpath::io!(stream, label = "redis");
stream.write_all(b"PING\r\n").await?;

let mut buf = [0u8; 7];
stream.read_exact(&mut buf).await?; // +PONG\r\n
See the basic_redis_io example.
The label parameter is optional; without it the wrapper is identified by file:line. Literal labels must be unique among io! sites within a crate: a repeated one fails cargo build/test/run with symbol `__hotpath_unique_io_redis_<crate hash>` is already defined (cargo check does not report it), so give a paired reader and writer distinct labels such as redis-read / redis-write. Labels passed as runtime expressions are not checked.
The wrapper derefs to the wrapped value, so its &self/&mut self methods are callable directly. For consuming methods (e.g. a codec’s finish(self)), unwrap first with hotpath::io_unwrap:
use std::io::Write;

let mut encoder = hotpath::io!(
    flate2::write::GzEncoder::new(Vec::new(), flate2::Compression::default()),
    label = "gzip"
);
encoder.write_all(data)?;
let compressed = hotpath::io_unwrap(encoder).finish()?;
With profiling disabled io! returns its argument unchanged and io_unwrap is the identity, so call sites compile identically in both modes.
See the basic_zstd_io example, which unwraps a zstd encoder with io_unwrap before finish().
Report entries are keyed by creation site and concrete type: wrappers created repeatedly at one io! call - for example per accepted connection in a server loop - accumulate into a single entry, so profiler memory stays bounded by the number of io! call sites rather than the number of values ever wrapped.
Measured layers
Wrapping the underlying resource (a File, TcpStream, or TLS stream) measures actual resource I/O: every syscall-level read and write, with buffering layers above it invisible.
Wrapping a BufReader or BufWriter instead measures application-facing buffered operations: many small reads served from the buffer, with the occasional large refill hidden inside them.
// Measures actual file I/O (large, infrequent reads).
let file = hotpath::io!(std::fs::File::open("data.bin")?, label = "file-raw");
let mut reader = std::io::BufReader::new(file);

// Measures application-facing reads (small, frequent, mostly buffer hits).
let mut reader = hotpath::io!(
    std::io::BufReader::new(std::fs::File::open("data.bin")?),
    label = "file-buffered"
);
Compression encoders
Write-side encoders (flate2::write::GzEncoder, brotli::CompressorWriter, zstd::stream::write::Encoder) do their compression work inside the write calls they receive, so wrapping the encoder measures compression throughput directly: the write row’s Bytes is the uncompressed input and Rate is how fast the codec consumes it. Two usage details keep those numbers honest.
Flush before unwrapping. A consuming finalizer (finish(self), into_inner(self)) runs after io_unwrap has removed the wrapper, so whatever work it performs is invisible to the profiler. Call flush() on the wrapper first: the encoder compresses and emits its buffered tail inside an instrumented flush operation, leaving only the stream epilogue to the finalizer. The tail is usually small - for brotli at quality 9 compressing 8 MB, the writes take ~680 ms while flush plus into_inner take ~1 ms - but the flush keeps the accounting complete regardless of how much the codec had buffered:
use std::io::Write;

let mut encoder = hotpath::io!(
    brotli::CompressorWriter::new(Vec::new(), 4096, 9, 22),
    label = "brotli"
);
encoder.write_all(data)?;
encoder.flush()?; // compress the buffered tail while still instrumented
let compressed = hotpath::io_unwrap(encoder).into_inner();
Wrap both sides to see the compression ratio. The encoder wrapper only counts uncompressed input bytes. Nest a second io! around the encoder’s sink and the report pairs two rows: input bytes at compression speed, and output bytes (at memcpy speed - that row’s Rate is not meaningful, its Bytes column is the point):
let mut encoder = hotpath::io!(
    flate2::write::GzEncoder::new(
        hotpath::io!(Vec::new(), label = "gzip-out"),
        flate2::Compression::new(9),
    ),
    label = "gzip"
);
The gzip row then reports e.g. 8.0 MB consumed at 19 MB/s while gzip-out reports the 1.0 MB that came out the other side. See the compression_levels_io example, which compares gzip and brotli across various compression levels.
Read-side encoders (flate2::read::GzEncoder, brotli::CompressorReader) invert the accounting: reads return compressed bytes, so the wrapper’s Bytes is the compressed output, and stream finalization happens inside the last instrumented reads. Wrap whichever side produces the number you want to read off the report.
Cancellation caveat
Async operation durations span from the first poll to Ready. If an operation’s future is cancelled mid-Pending (e.g. a tokio::select! timeout drops a read() future), the wrapper cannot observe the cancellation; the next operation in the same direction resumes the pending span and reports the time since the abandoned operation began.
Report
The terminal report renders reads and writes as stacked sub-tables (a sub-table is skipped if there were no operations of that kind). The write sub-table carries the flush count, and its Errors column aggregates write, flush, and shutdown errors so failures surfaced during flush aren’t hidden; per-kind error counts appear in the JSON report, where shutdown operations are also broken out. Metrics are also exposed at GET /io and in the TUI on the I/O tab, Bytes sub-tab.
Entries are keyed by creation site: all wrapper instances created at one io! call (e.g. per accepted connection in a server) accumulate into a single row, and the Inst column shows how many instances that row aggregates. Pass iter = true to give every instance its own row instead (displayed as label, label-2, label-3, …) with individual rates and byte counts - profiler state then grows with the number of instances ever created, so prefer the default aggregation for call sites with unbounded instance churn.
Rate is per-operation transfer speed - bytes divided by summed in-flight operation time (waiting included, so on request/response traffic it reads as application-observed speed rather than wire speed). For a row aggregating concurrent instances the rate stays duration-weighted per operation, not the call site’s aggregate bandwidth; Rate * Inst bounds the aggregate from above when all instances operate concurrently. Under time sampling the rate is computed from timed operations only, and shows - in count-only mode.
The number of I/O wrappers shown is unlimited by default (0). Cap it with:
- Builder:
.io_limit(n) - Env var:
HOTPATH_IO_LIMIT
The wrapper does not implement Seek, AsyncSeek, BufRead, or AsyncBufRead, so a wrapped value cannot be used where those traits are required.