Profiling Async and Concurrent Rust: Channels and Lock Contention
Published: June 23, 2026
Reading time: 11 minutes
Traditional Rust profilers can reveal where your application spends CPU time, but they often cannot explain why async or concurrent code is waiting. Queue buildup, channel throughput, message processing latency, and lock contention can be difficult or impossible to observe with standard profilers.
In this blog post I’ll describe instrumentation APIs recently introduced to hotpath-rs that provide observability into async and concurrency bottlenecks. I’ll also explain the new "wrap" channel instrumentation introduced in hotpath 0.18.0, and how I used it to profile the profiler itself to discover its breaking point.

Trait types instrumentation
Let’s start by briefly explaining how hotpath implements instrumentation. We use a proxy wrapper pattern to add instrumentation on top of existing types. It’s simple for types which are represented as traits in the type system. So for example Future or Stream can be wrapped into an instrumentation layer, without making the compiler angry:
pub struct InstrumentedFuture<F: Future> {
    #[pin]
    inner: F,
    future_id: u32,
    // ...
}
Here’s an InstrumentedFuture struct hotpath uses to add observability for async functions. It holds a reference to the original inner future, and implements a custom poll method that does the actual instrumentation. So the runtime calls the instrumented poll function that internally calls poll of the inner object:
impl<F: Future> Future for InstrumentedFuture<F> {
    fn poll(self: Pin<&mut Self>, cx: &mut Context<'_>) -> Poll<Self::Output> {
        let start = Instant::now();
        let poll_result = self.inner.poll(cx);
        let elapsed = start.elapsed();
        let _ = self.sender.send(Measurement {
            name: self.future_id,
            duration: elapsed,
        });
        poll_result
    }
}#[hotpath::measure] or hotpath::future! return this type, so e.g. the original Future<u64> type becomes InstrumentedFuture<u64>. But it’s still a Future trait so types remain consistent in the codebase. Relying on traits instead of concrete types makes hotpath instrumentation relatively seamless to apply even in complex codebases.
We use exactly the same principle for Stream, wrapping it into an InstrumentedStream with a custom poll_next proxy function:
pub struct InstrumentedStream<S> {
    #[pin]
    inner: S,
    id: u32,
}
Instrumenting MPSC channels
But, unfortunately, there’s no universal Channel trait, each Rust library defines a custom type. So we cannot wrap std::sync::mpsc::Sender<T> into our InstrumentedSender type and expect the compiler to play along.
hotpath-rs currently supports observability for channels from the following libraries:
You can observe the number of sent/received events, and inspect individual messages.

ssh demo.hotpath.rsBut it’s all based on a “hack”.
hotpath::channel! macro returns identical types, so you only need a minimal code change to enable channel monitoring:
let (tx, rx) = hotpath::channel!(std::sync::mpsc::channel::<String>());hotpath::channel! rearranges the original sender and receiver using internal proxy channels. So while the sender remains the same, the receiver is listening on a dedicated new thread. Each received message is instrumented and forwarded to a new sender-receiver pair and eventually to the client code. For bounded channels we use a proxy with a size of 1, so measurements are accurate, just “off by one”. Channel capacity is not encoded in the type, so we can do it without impacting the rest of the codebase.
See wrap_sync_channel_impl for implementation details.
Unfortunately, for unbounded channels, we have to use an unbounded proxy so we cannot reliably measure message delay or queue size. Any amount of messages is instantly ingested by the proxy, regardless of the final receiver throughput.
Introducing hotpath::wrap instrumentation pattern
This limitation has bothered me since I’ve started working on this lib. hotpath uses unbounded crossbeam channels for delivering instrumentation messages. I want to observe the real delay of messages delivery, and see if there’s queue buildup or unbounded memory bloat. It’s not possible with the proxy channels-based instrumentation.
To solve the issue I recently came up with a new hotpath::wrap pattern for instrumenting channels. hotpath 0.18.0 adds a new wrap = true config to channel! macro.
let (tx, rx) = hotpath::channel!(std::sync::mpsc::channel::<String>(), wrap = true);It completely changes channels instrumentation implementation, making it work similarly to the previously described traits. Instead of spawning internal proxies wrap = true wraps Sender and Receiver into a custom instrumentation layer, returning new types:
std::sync::mpsc::Sender<String> -> hotpath::wrap::std::sync::mpsc::Sender<String>
std::sync::mpsc::Receiver<String> -> hotpath::wrap::std::sync::mpsc::Receiver<String>
See the consistent hotpath::wrap prefix. I’m using this convention to minimize the scope of migration. We’re returning new types, so using the wrap API you’ll have to adjust your codebase. So unless --features=hotpath is enabled, hotpath::wrap::* resolves to the original type (it’s a simple public reexport).
For the price of applying hotpath::wrap prefixes to your types you can observe the following metrics for each channel:
- current queue depth
- max queue depth
- max memory usage
- avg, p95 etc. message processing delay
Summing up:
| Approach | Code changes | Queue depth | Message delay |
|---|---|---|---|
| Proxy channels | Minimal | No | No |
wrap = true | Requires wrapper types | Yes | Yes |
This method is not seamless. For example, crossbeam::select! macro is currently not compatible with hotpath::wrap types, so I needed a workaround using crossbeam::Select. For now I’ve focused on implementing the basic API surface (send,try_send,send_timeout,len etc.), but I’ll try to make the implementation more robust and flexible.
It’s a recent addition to hotpath and currently supports only crossbeam and std::sync channels. I’m looking forward to feedback if you see this kind of type juggling as acceptable and whether you’d like to see similar "wrap" instrumentation available for more libraries.
Using meta channels instrumentation
hotpath-meta performance metricsThis TUI screenshot might not look particularly exciting, but it shows hotpath-meta metrics that I’ve wanted to capture for a long time. See CONTRIBUTING.md for details on how I profile the profiler using itself. In short, I use a full clone of the hotpath crate (hotpath-meta) to benchmark and profile hotpath’s own overhead and scalability.
The screenshot displays metrics from an instrumented Zed fork. I regularly use it to validate that hotpath’s approach to profiling works with slightly more complex Rust programs. hotpath aggregates measurements in a thread-local cache, and sends them in batches of 64 for background processing. The methods instrumented in that fork peak at roughly 128k (2k batches of 64) function call events per second, and hotpath’s background consumer threads process that load without observable queue buildup.
To better understand the limits of hotpath’s data ingestion pipeline, I created a small benchmark_load.rs stress test.
Here are the results just before and just after the breaking point:
HOTPATH_BENCH_THREADS=3 HOTPATH_META_REPORT=channels cargo run --example benchmark_load --features hotpath,hotpath-meta --release
channels - Channel throughput statistics.
+---------+-----------+---------+----------+----------+----------+-----------+
| Channel | Type      | Sent    | Received | Sent/s   | Recv/s   | Max queue |
+---------+-----------+---------+----------+----------+----------+-----------+
| hp-fn   | unbounded | 1386902 | 1386904  | 276946.1 | 276946.4 | 538       |
+---------+-----------+---------+----------+----------+----------+-----------+

channels latency - Channel send->receive latency statistics (wrap channels only).
+---------+---------+----------+----------+
| Channel | Msgs    | Avg      | P95      |
+---------+---------+----------+----------+
| hp-fn   | 1386904 | 12.91 µs | 15.01 µs |
+---------+---------+----------+----------+
HOTPATH_BENCH_THREADS=4 HOTPATH_META_REPORT=channels cargo run --example benchmark_load --features hotpath,hotpath-meta --release
channels - Channel throughput statistics.
+---------+-----------+---------+----------+----------+----------+-----------+
| Channel | Type      | Sent    | Received | Sent/s   | Recv/s   | Max queue |
+---------+-----------+---------+----------+----------+----------+-----------+
| hp-fn   | unbounded | 1521090 | 1288779  | 302859.8 | 256605.0 | 233357    |
+---------+-----------+---------+----------+----------+----------+-----------+

channels latency - Channel send->receive latency statistics (wrap channels only).
+---------+---------+----------+-----------+
| Channel | Msgs    | Avg      | P95       |
+---------+---------+----------+-----------+
| hp-fn   | 1288779 | 78.97 ms | 287.57 ms |
+---------+---------+----------+-----------+
On my machine, hotpath’s background processing pipeline can sustain roughly 17 million (270k * 64) profiling events per second before queue buildup and latency become noticeable. The exact number is less important than the visibility: these metrics make it obvious when the consumer thread starts to fall behind. I’m showing this example to highlight that understanding queue growth, throughput bottlenecks, and message latency distributions can be invaluable when designing and validating concurrent systems.
Observability for contention bottlenecks
Recently introduced hotpath::rw_lock! and hotpath::mutex! macros use exactly the same principle. hotpath reimplements the basic API surface of lock, try_lock, into_inner, get_mut etc. on the custom instrumented type.
This makes it possible to observe lock contention that traditional profilers often miss. For example, a task might acquire a mutex and then perform a slow database query, HTTP request, or other blocking operation while holding the guard. The CPU profiler may show very little activity, but other tasks will spend significant time waiting for the lock. hotpath tracks both wait time and guard hold time, making these bottlenecks immediately visible.

Just like the wrap = true channels, the wrappers live under the hotpath::wrap:: namespace and resolve back to the original type unless --features=hotpath is enabled. For RwLock variants read and write operations are tracked separately, so you can tell whether contention originates from readers, writers, or both.
Currently, the following lock types are supported:
RwLock (via hotpath::rw_lock!):
Mutex (via hotpath::mutex!):
Summary
Recent hotpath releases introduced new APIs that provide observability into async execution, channels, and contention bottlenecks. Some require additional integration effort, but in exchange, they expose metrics that traditional profilers often miss.
My long-term goal for hotpath-rs is to become the single place to understand all performance signals in a Rust application. From CPU and memory usage to locks, channels, and async execution, all the way up to SQL queries and HTTP/RPC calls.
The challenge is that more visibility often creates more noise. As hotpath gains support for additional signal types, understanding what actually matters becomes increasingly difficult. That’s why I’m also building a hosted version focused on highlighting meaningful regressions, comparing results across changes, and helping teams separate metrics that matter from background noise.
If that idea resonates with you, join the waitlist below to get early access when it launches. Every signup also helps validate that I’m solving a real problem and motivates me to keep building hotpath after hours.
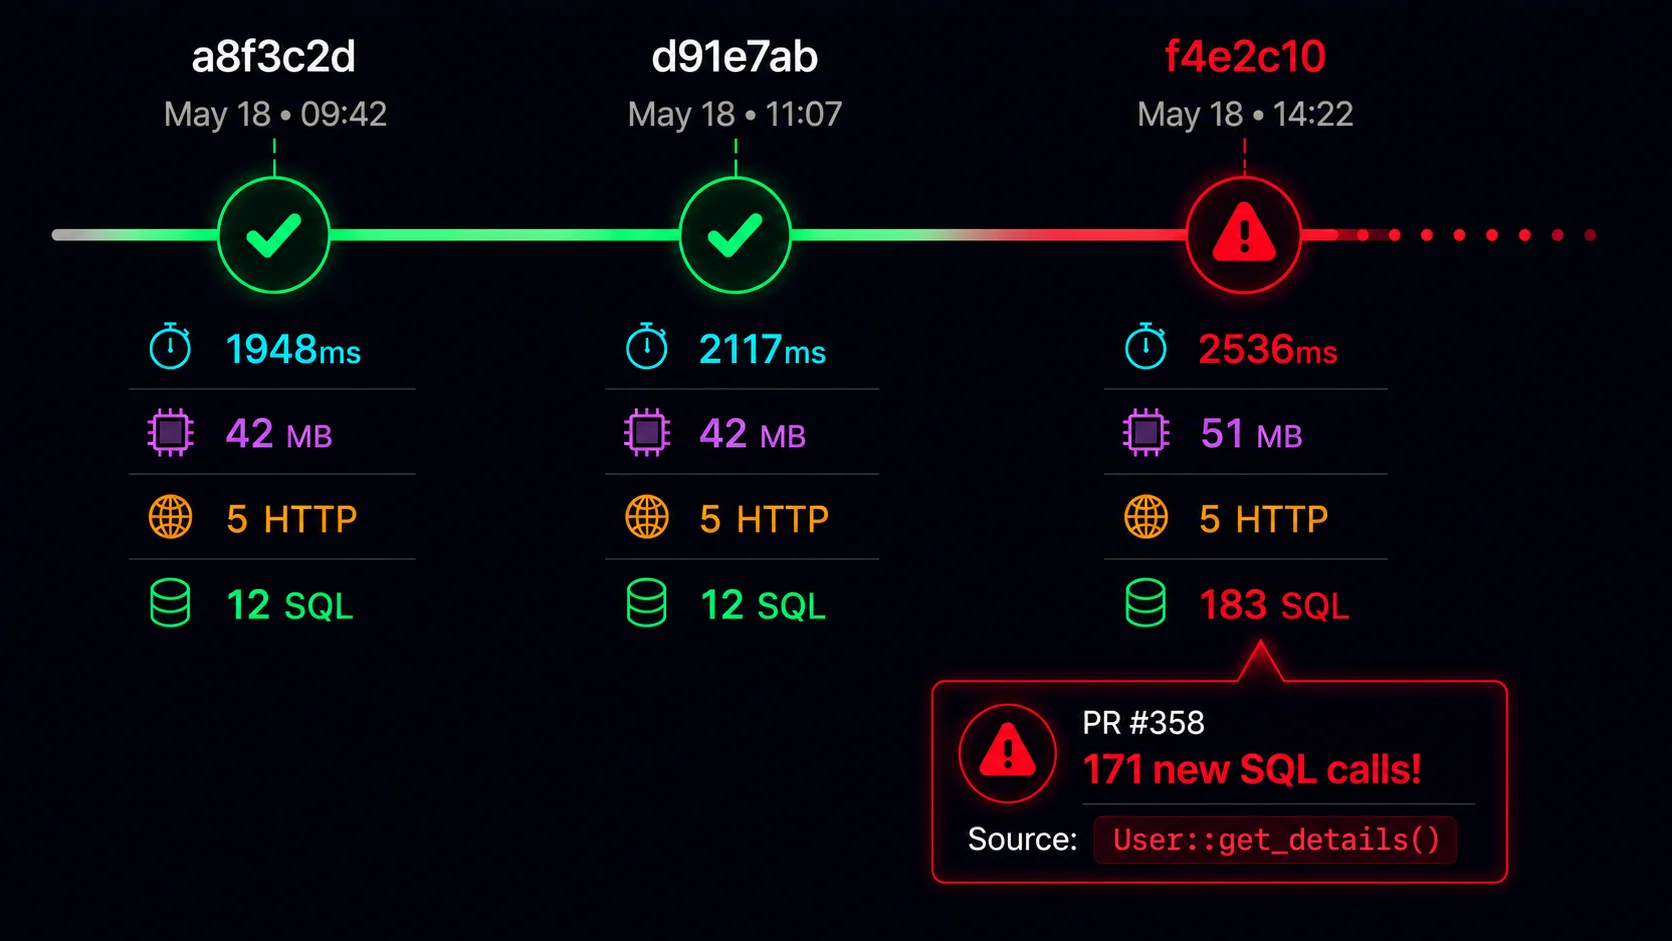
Every Rust PR gets a performance review.
Catch regressions in memory, SQL queries, HTTP calls and concurrency bottlenecks before they reach production. Iterate on reproducible signals, not CI noise.
Launching soon • Early access invitations will be sent to waitlist members first.
Building in public. Follow progress and feature releases on X: @_pawurb