Rust Memory Profiling: Track Allocations, Threads, and RSS
hotpath-rs gives you three complementary views into the memory behavior of a Rust program:
- Per-function allocations - how many bytes and allocations each instrumented function is responsible for. Use it to find allocation hotspots.
- Per-thread allocations - bytes allocated and deallocated by each thread. Use it to find which threads generate the allocation traffic.
- Process RSS - the resident memory footprint of the whole process and its peak. Use it to see how much physical memory the program actually holds.
These metrics answer different questions, and none of them replaces the others. A function can allocate gigabytes of short-lived buffers while RSS stays flat, and RSS can grow while allocation counters barely move. Reading them together tells you whether a memory problem is allocation churn, retained data, or something outside the heap entirely.
Quick start
Add hotpath to your Cargo.toml behind feature flags:
[dependencies]
hotpath = "0.32"

[features]
hotpath = ["hotpath/hotpath"]
hotpath-alloc = ["hotpath", "hotpath/hotpath-alloc"]
Annotate the entry point with #[hotpath::main] and the functions you want to profile with #[hotpath::measure]:
#[hotpath::measure]
fn build_buffer(size: usize) -> Vec<u8> {
    vec![0u8; size]
}

#[hotpath::measure]
fn format_lines(count: usize) -> Vec<String> {
    (0..count).map(|i| format!("line {i}")).collect()
}

#[hotpath::main]
fn main() {
    for _ in 0..100 {
        let buffer = build_buffer(64 * 1024);
        let lines = format_lines(100);
        std::hint::black_box((&buffer, &lines));
    }
}
Run it with the hotpath-alloc feature:
cargo run --features='hotpath-alloc'
On exit, the report prints an alloc-bytes section next to the usual timing table, and the threads section gains per-thread allocation columns and process memory stats (timing and part of the threads table omitted):
[hotpath] 7.81ms | timing, alloc, threads

alloc-bytes - Exclusive allocation bytes by each function (excluding nested calls).
Total: 6.6 MB
+---------------------------+-------+---------+---------+----------+---------+
| Function                  | Calls | Avg     | P95     | Total    | % Total |
+---------------------------+-------+---------+---------+----------+---------+
| memory_demo::build_buffer | 100   | 64.0 KB | 64.1 KB | 6.2 MB   | 95.07%  |
+---------------------------+-------+---------+---------+----------+---------+
| memory_demo::format_lines | 100   | 3.3 KB  | 3.3 KB  | 332.0 KB | 4.93%   |
+---------------------------+-------+---------+---------+----------+---------+
| memory_demo::main         | 1     | 0 B     | 0 B     | 0 B      | 0.00%   |
+---------------------------+-------+---------+---------+----------+---------+

threads - Thread CPU and memory statistics. (Max RSS: 6.4 MB, Alloc: 6.6 MB, Dealloc: 6.6 MB, Diff: 608 B, 5/6)
+-------------+------+------+--------+---------+-------+
| Thread      | Max% | Avg% | Alloc  | Dealloc | Diff  |
+-------------+------+------+--------+---------+-------+
| main        | -    | -    | 6.6 MB | 6.6 MB  | -24 B |
+-------------+------+------+--------+---------+-------+
When the hotpath feature is disabled, all macros are no-ops: no tracking allocator is installed and no hotpath dependencies are compiled. Every profiling feature also enables hotpath, so --features='hotpath-alloc' is enough on its own. See the installation guide for the full setup, or the live TUI dashboard to watch the same metrics while the program runs.
Profile allocations per function
With hotpath-alloc enabled, hotpath installs a tracking global allocator based on the allocation-counter crate. Every allocation is counted and attributed to the innermost instrumented function currently running on that thread. Functions annotated with #[hotpath::measure], #[hotpath::measure_all] and hotpath::measure_block! scopes all get their own rows. Async functions are measured per poll(), so allocations are attributed correctly even when a future moves between Tokio worker threads.
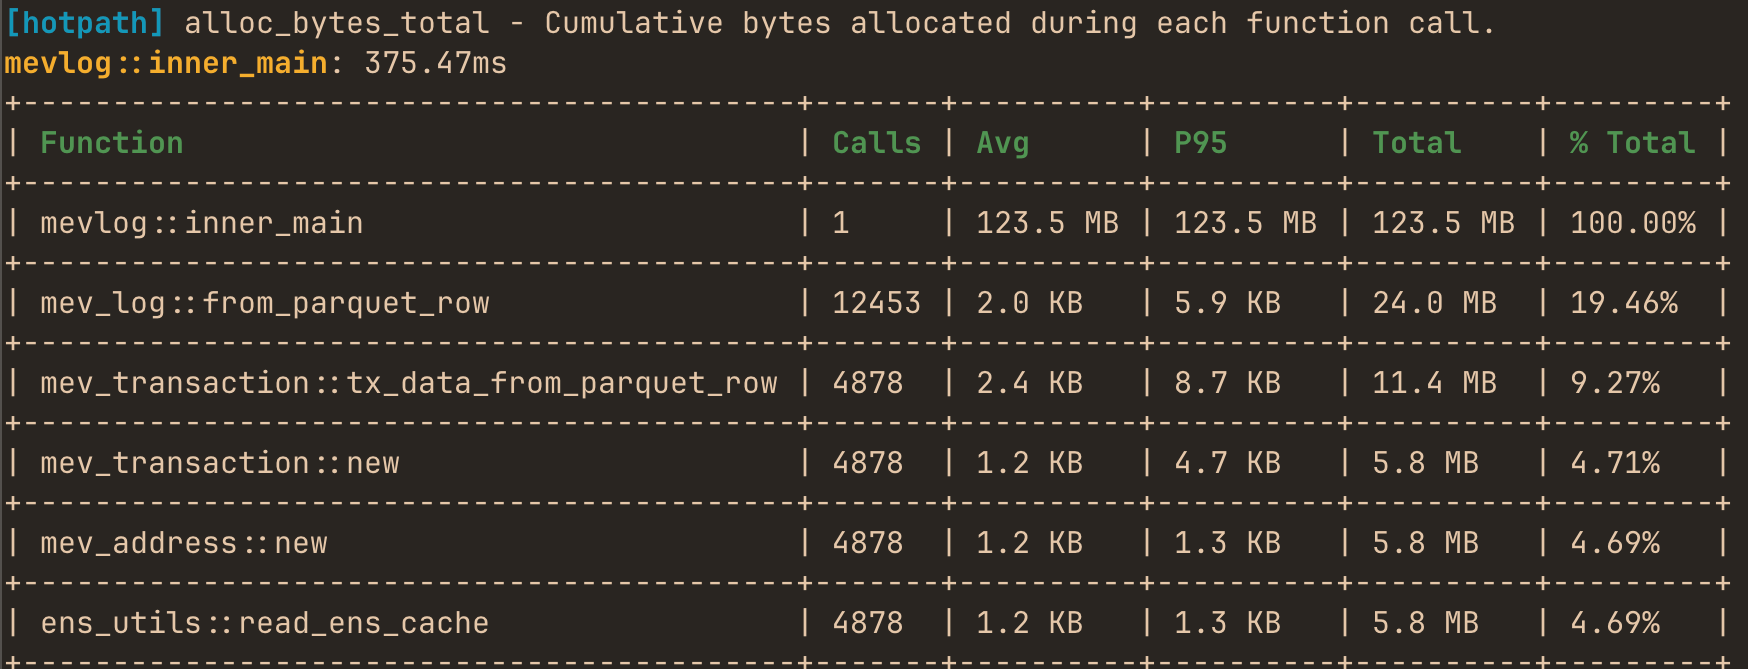
Each row shows the number of calls, the average and percentile bytes allocated per call, the total bytes allocated over the run, and the function’s share of all allocated bytes. By default, the report sorts and displays by bytes. Set HOTPATH_ALLOC_METRIC=count to use the number of allocations as the primary metric instead:
HOTPATH_ALLOC_METRIC=count cargo run --features='hotpath-alloc'
To find allocation hotspots, look at two things:
- Total and % Total - which functions dominate the allocation traffic of the whole run.
- Avg and percentiles - which individual calls are expensive, even if they run rarely.
Keep in mind that these numbers measure allocation traffic, not memory held. A function that allocates and frees a buffer on every call can account for most of the allocated bytes while RSS stays completely stable. That traffic still costs CPU time in the allocator, puts pressure on caches and often hides avoidable copies, which is why it’s worth reducing even without a memory growth problem. The Rust profiling guide walks through a real example that removes gigabytes of String clone allocations.
In the live TUI, press 1 to open the Functions tab and press it again to toggle between its Timing and Memory views.
Exclusive vs cumulative allocation tracking
By default, allocation tracking is exclusive: each function reports only the allocations made directly at its own level, excluding nested instrumented calls. Consider a handler that allocates a small header and calls an instrumented function allocating a 64 KB body:
#[hotpath::measure]
fn build_buffer(size: usize) -> Vec<u8> {
    vec![0u8; size]
}

#[hotpath::measure]
fn handle_request() -> usize {
    let header = String::from("request header");
    let body = build_buffer(64 * 1024);
    header.len() + body.len()
}
The exclusive report charges the body to build_buffer and only the header to handle_request, so every row points directly to the code doing the allocating:
alloc-bytes - Exclusive allocation bytes by each function (excluding nested calls).
Total: 6.3 MB
+-----------------------------+-------+---------+---------+--------+---------+
| Function                    | Calls | Avg     | P95     | Total  | % Total |
+-----------------------------+-------+---------+---------+--------+---------+
| memory_demo::build_buffer   | 100   | 64.0 KB | 64.1 KB | 6.2 MB | 99.98%  |
+-----------------------------+-------+---------+---------+--------+---------+
| memory_demo::handle_request | 100   | 14 B    | 14 B    | 1.4 KB | 0.02%   |
+-----------------------------+-------+---------+---------+--------+---------+
Set HOTPATH_ALLOC_CUMULATIVE=true to switch to cumulative mode, where a function’s numbers include all allocations made by the instrumented functions it calls:
HOTPATH_ALLOC_CUMULATIVE=true cargo run --features='hotpath-alloc'
alloc-bytes - Cumulative allocation bytes during each function call (including nested calls).
Total: 6.3 MB
+-----------------------------+-------+---------+---------+--------+---------+
| Function                    | Calls | Avg     | P95     | Total  | % Total |
+-----------------------------+-------+---------+---------+--------+---------+
| memory_demo::handle_request | 100   | 64.0 KB | 64.1 KB | 6.3 MB | 100.00% |
+-----------------------------+-------+---------+---------+--------+---------+
| memory_demo::main           | 1     | 6.3 MB  | 6.3 MB  | 6.3 MB | 100.00% |
+-----------------------------+-------+---------+---------+--------+---------+
| memory_demo::build_buffer   | 100   | 64.0 KB | 64.1 KB | 6.2 MB | 99.98%  |
+-----------------------------+-------+---------+---------+--------+---------+
Cumulative mode answers “how much does this whole call tree allocate”, which is useful for comparing top-level entry points such as request handlers. The rows overlap, so their percentages no longer add up to 100%. It also produces invalid results for recursive functions: the same allocation is counted once in every recursive frame it propagates through.
Monitor memory allocations per thread
The threads section of the report and the TUI Threads tab track every thread of the profiled process. Thread monitoring is enabled by default via the threads feature, but the per-thread Alloc, Dealloc and Diff columns require hotpath-alloc, because they come from the same tracking allocator. Unlike the functions report, they count every allocation a thread makes, whether or not it happens inside an instrumented function.
- Thread - the name set with
std::thread::Builder::nameor by the runtime (e.g.tokio-runtime-w). Unnamed threads show up asthread_N, so naming the threads you spawn makes this view far more useful. - TID - the OS thread identifier (live TUI and JSON), matching what
htop -H,gdband sampling profilers report. - Alloc / Dealloc - total bytes allocated and deallocated by the thread that performed the operation.
- Diff - Alloc minus Dealloc for that thread.
Threads that already exited keep their counters, so short-lived worker threads still show up in the final report. Rows are sorted by allocation traffic, and the number of rows in the final report is capped by threads_limit / HOTPATH_THREADS_LIMIT (default: 5). The header line also shows process-wide Alloc, Dealloc and Diff totals across all threads.
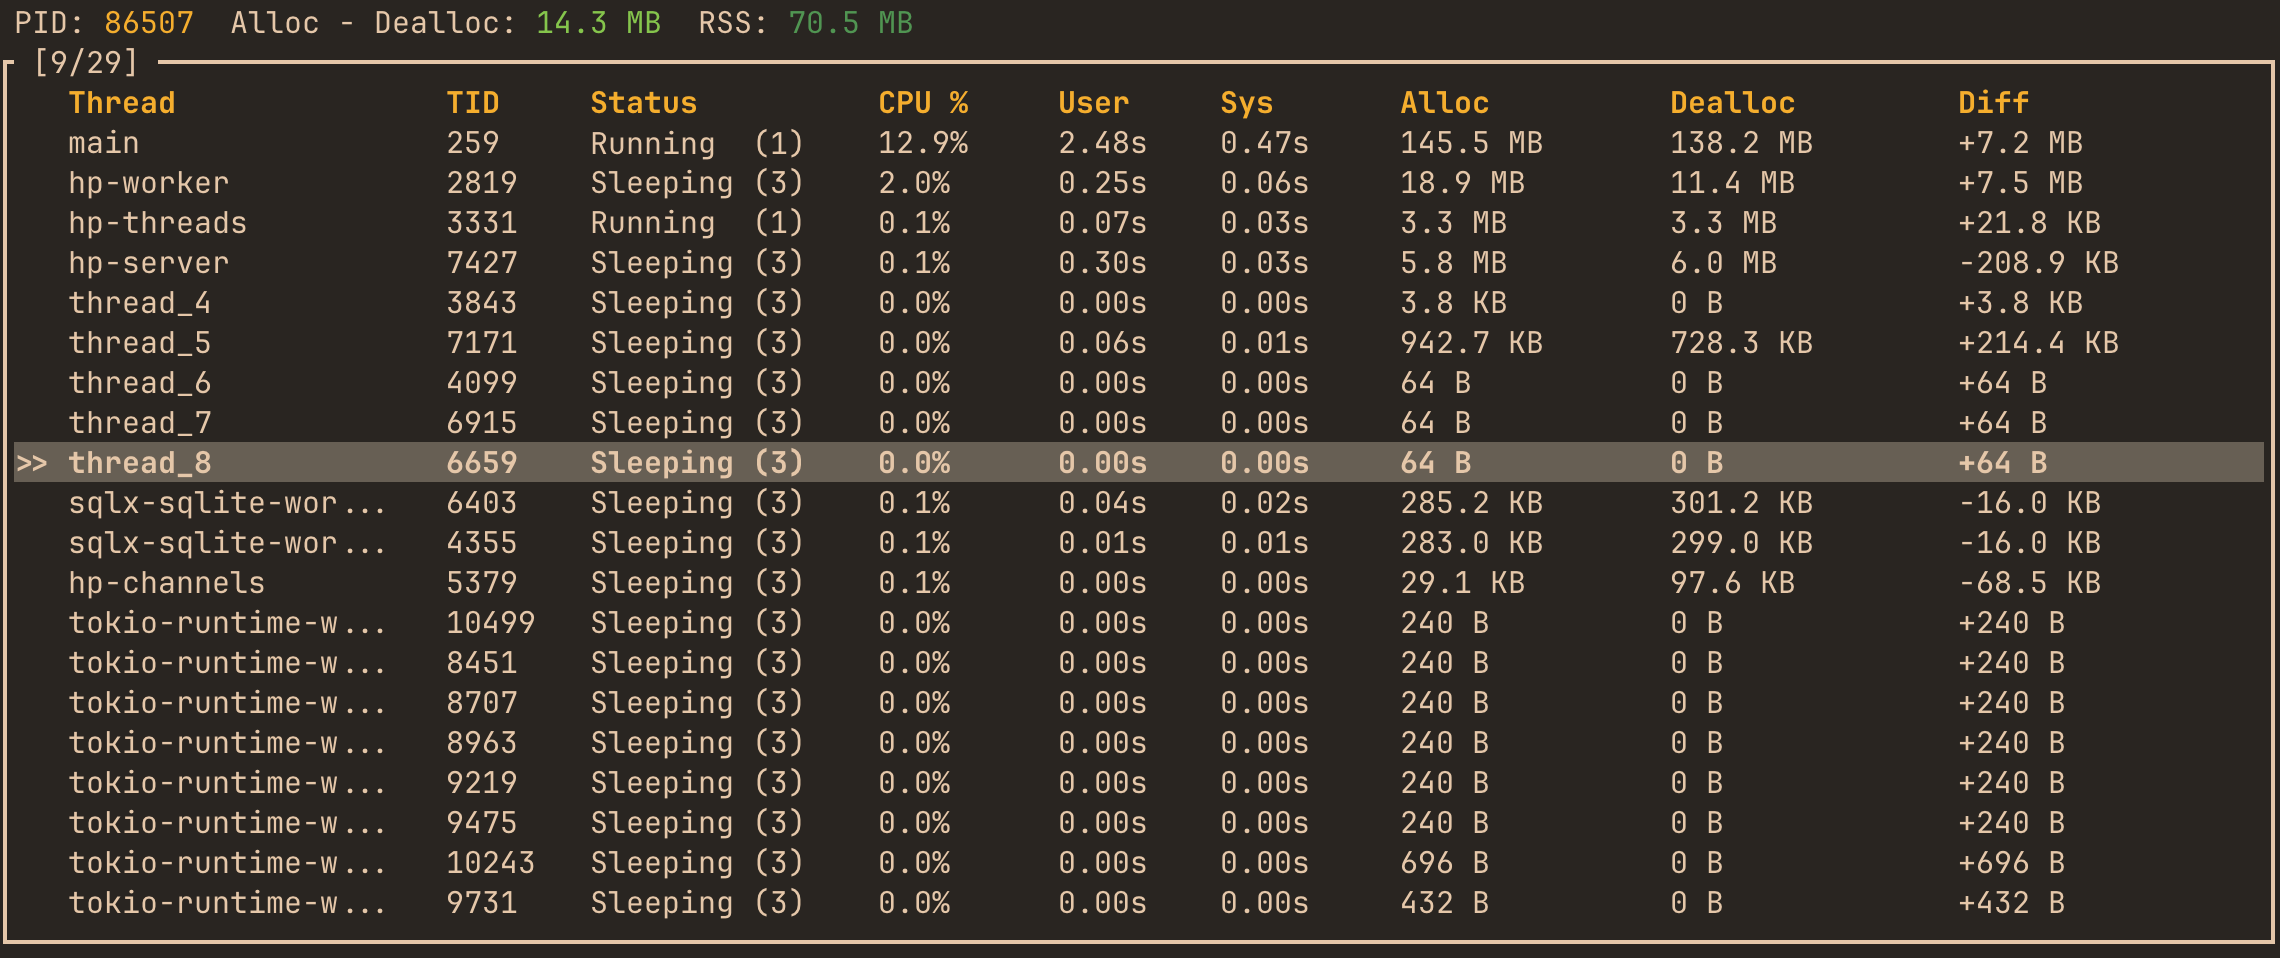
To find the threads responsible for heavy allocation traffic, compare their Alloc and Dealloc columns: high values on both sides mean the thread churns through short-lived allocations. In the live TUI, press 4 to open the Threads tab and watch the counters update in real time:
Reading a growing Diff
A thread whose Diff keeps growing under steady-state load allocates more than it frees. That is a useful signal, but not proof of a leak, and not a measure of how much memory the thread owns. Diff is attributed to the thread performing each operation: memory allocated on one thread and freed on another raises Diff on the first and lowers it on the second. A producer thread that sends Strings through a channel to a consumer will show a positive Diff, and the consumer a negative one, even though nothing is retained. The installation example shows exactly that with Tokio: a worker that frees buffers allocated elsewhere ends up with -70.0 KB.
So treat per-thread Diff as a pointer to where to look, then confirm with the functions report and the code. A positive Diff that keeps growing on a thread which doesn’t hand data to other threads is the strongest signal of retained memory. For CPU usage, thread states and the full thread metrics reference, see the threads monitoring docs.
Monitor process memory usage: RSS and Max RSS
The thread monitor also reports process-wide memory usage. Both values describe the whole process, not individual threads: the operating system does not track resident memory per thread.
- RSS (Resident Set Size) - the physical memory the process occupies right now. On Linux it’s read from
/proc/self/statm, on macOS from the task’s resident size, on Windows from the process working set. - Max RSS - the highest RSS recorded for the program since it started, so a short spike between two refreshes is never missed. On Linux it comes from
VmHWMin/proc/self/statusand covers the program itself only: memory used by a launcher that exec’d into it, such ascargo runbuilding the binary first, is not included. If/proc/self/statuscan’t be read (some sandboxes), hotpath falls back togetrusage, which may include that launcher memory. On macOS Max RSS comes fromgetrusage, and on Windows from the peak working set.
The live TUI shows both in the Threads tab header. The final report keeps only Max RSS, in the threads section header, since a snapshot taken at exit says little about the run.
RSS vs allocated bytes
RSS and the allocation counters measure different things, and they often move independently:
- RSS can stay high after memory is freed. Allocators keep freed pages around for reuse instead of returning them to the OS right away, so a drop in Diff doesn’t necessarily lower RSS.
- RSS includes more than your heap allocations. Code and data of the binary and its libraries, thread stacks, memory-mapped files and allocator metadata all count towards it, and none of them shows up in Alloc or Diff.
- Allocation counters include memory that never becomes resident at once. The allocator reuses the same pages for short-lived allocations, so a program can allocate far more bytes in total than its peak RSS.
The quick start above is a good example: it allocates 6.6 MB in total, with a Max RSS of 6.4 MB that includes the binary and runtime itself. Each 64 KB buffer is freed before the next one is created, so the allocator keeps reusing the same memory. Run the same loop a thousand times longer and the allocated bytes grow a thousandfold, while Max RSS stays roughly where it was. That is why Max RSS and cumulative allocated bytes are not interchangeable: the first measures peak footprint, the second allocation traffic.
Investigating suspected memory leaks
Allocation counters and RSS are diagnostic signals. Combined, they narrow a memory problem down to a thread and a function, but they can’t tell you which object or data structure is holding on to memory. A practical workflow:
- Observe the trend. Run the program under steady-state load with
hotpath-allocand watch RSS and the process-wide Diff in the TUI Threads tab. Growth that stops after warm-up (caches filling, pools reaching their size) is usually expected; growth that continues for as long as the load runs is worth investigating. - Find the thread. Look for threads whose Diff keeps climbing. Check whether they pass data to other threads, since that shifts Diff between them (see Reading a growing Diff).
- Find the functions. Switch to the functions Memory view (or the
alloc-bytesreport section) to see which instrumented functions allocate the most. Add#[hotpath::measure]to more functions in the suspicious area to narrow it down. - Inspect the code. Look for collections that only grow, caches without eviction, handles or tasks that are never dropped, or unnecessary copies that create allocation churn.
- Repeat and compare. Rerun the same workload after the change and compare the numbers. With hotpath-cloud, allocation and RSS changes are reported on every pull request.
If RSS grows while Diff stays flat, the memory most likely comes from outside the tracked heap (for example memory-mapped files or allocator fragmentation). If Diff grows but you can’t find a data structure responsible for it, a heap profiler that records allocation call stacks can complement hotpath.
Advanced memory profiling configuration
Custom inner allocator
The tracking allocator forwards every allocation to an inner allocator, std::alloc::System by default. To profile a program that uses a different allocator, pass it via the allocator parameter of #[hotpath::main]. For example, with tikv-jemallocator:
[dependencies]
tikv-jemallocator = "0.6"
#[hotpath::measure]
fn alloc_work() {
    let buf = vec![0u8; 4096];
    std::hint::black_box(&buf);
}

#[hotpath::main(allocator = tikv_jemallocator::Jemalloc)]
fn main() {
    for _ in 0..100 {
        alloc_work();
    }
}
cargo run --features='hotpath-alloc'
The report now shows per-function allocation stats measured through jemalloc: every allocation is counted by the tracking wrapper, then served by jemalloc instead of the system allocator.
The path must name a unit struct implementing GlobalAlloc (like MiMalloc from mimalloc or Jemalloc from tikv-jemallocator). When the hotpath-alloc feature is disabled, the parameter is ignored and no allocator is installed, so combine it with your own #[global_allocator] behind a feature gate if the program should also use the allocator in normal builds.
All four GlobalAlloc methods (alloc, dealloc, alloc_zeroed, realloc) forward to the inner allocator’s native implementations, so wrapping does not change its zeroed-allocation or reallocation behavior. A successful realloc is tracked as a deallocation of the old size plus an allocation of the new size.
Allocation tracking with HotpathGuardBuilder
The #[hotpath::main] macro installs the tracking allocator for you. The HotpathGuardBuilder API does not do that (a #[global_allocator] must be declared as a static item), so when initializing hotpath programmatically you must declare it yourself:
#[global_allocator]
static GLOBAL: hotpath::CountingAllocator = hotpath::CountingAllocator::new();

fn main() {
    let _hotpath = hotpath::HotpathGuardBuilder::new("main").build();
    // ...
}
Use hotpath::CountingAllocator::with(...) to wrap a custom inner allocator:
#[global_allocator]
static GLOBAL: hotpath::CountingAllocator<tikv_jemallocator::Jemalloc> =
    hotpath::CountingAllocator::with(tikv_jemallocator::Jemalloc);
The declaration needs no feature gating: CountingAllocator is exported in every feature configuration, and when hotpath-alloc (or hotpath itself) is disabled it is a pure pass-through to the inner allocator with no tracking overhead. This also makes it the simplest way to keep a custom allocator active in normal builds: the program always runs on jemalloc, and allocation tracking switches on only with hotpath-alloc.
Don’t combine a manual declaration with #[hotpath::main] - under hotpath-alloc the macro installs its own #[global_allocator], and two declarations fail to compile. Use the allocator parameter with the macro, and the manual declaration with the builder.
Report sections and environment variables
With hotpath-alloc, the default report includes functions-timing, functions-alloc and threads. Select sections with the report parameter of #[hotpath::main] or the HOTPATH_REPORT env var, for example to print only memory metrics:
#[hotpath::main(report = "functions-alloc,threads")]
fn main() {
    // ...
}
Memory-related settings (see Configuration for the full list):
| Variable | Description |
|---|---|
HOTPATH_ALLOC_CUMULATIVE | true switches functions to cumulative allocation tracking (default: exclusive) |
HOTPATH_ALLOC_METRIC | Primary metric of the functions allocation report: bytes (default) or count |
HOTPATH_ALLOC_MAX_DEPTH | Maximum number of nested measured functions per thread in alloc mode, read at build time; raise it for deeply recursive code |
HOTPATH_THREADS_LIMIT | Number of rows in the final threads report (default: 5) |
HOTPATH_THREADS_INTERVAL_MS | Sampling interval of thread CPU and memory metrics (default: 250ms) |
FAQ
How do I profile memory allocations in Rust?
Add hotpath with a hotpath-alloc feature, annotate main with #[hotpath::main] and the functions you care about with #[hotpath::measure], then run cargo run --features='hotpath-alloc'. The report shows allocated bytes and counts per function and per thread. See the quick start.
How can I identify which Rust function allocates the most memory?
Sort by the Total column of the alloc-bytes report section: in the default exclusive mode, each row counts only the allocations made by the function itself. Set HOTPATH_ALLOC_METRIC=count to rank by number of allocations instead.
How do I monitor memory usage per thread?
Enable hotpath-alloc and check the threads section of the report or the TUI Threads tab. It shows bytes allocated and deallocated by each thread. Name your threads with std::thread::Builder::name to tell them apart.
What’s the difference between RSS and allocated bytes?
Allocated bytes count heap allocation traffic made through the global allocator. RSS is the physical memory the whole process occupies, including code, thread stacks, mappings and memory the allocator keeps for reuse. See RSS vs allocated bytes.
Can hotpath-rs help investigate memory leaks?
Yes, as a first step. A growing RSS or per-thread Diff under steady load points to retained memory, and the functions report shows which instrumented code allocates it. hotpath does not record which objects hold on to memory, so it can’t prove a leak on its own. See Investigating suspected memory leaks.
Can I use hotpath with jemalloc or mimalloc?
Yes. Pass the allocator with #[hotpath::main(allocator = tikv_jemallocator::Jemalloc)] (or mimalloc::MiMalloc), or wrap it in hotpath::CountingAllocator::with(...) when using HotpathGuardBuilder. See Custom inner allocator.
Related: Wall-clock time · Threads · CPU profiling · Profiling modes · Configuration