Rust Benchmarking: How to Detect Performance Regressions in CI
Published: November 10, 2026
Reading time: 22 minutes
I ran the exact same Rust benchmark 100 times on GitHub Actions without changing a single line of code. Wall-clock execution times varied by almost 3x, while CPU instruction counts stayed within 0.13%, and the number of bytes allocated was identical in every run.
In this article, I’ll describe how I’m profiling hotpath-rs with a suite of (mostly) deterministic performance benchmarks. We have a lot to cover: Callgrind CPU instructions, x86 vs ARM, augmenting existing Criterion.rs benchmarks, and low-level optimizations. Finally, I’ll show how different metrics can be combined with configurable regression policies and performance budgets to detect regressions automatically in GitHub CI using hotpath-cloud.
Profiling the profiler
In this blog post, we’ll focus on CI integration. The most effective approach to monitor a project’s performance is to automate regression testing as much as possible. With AI-assisted development, manual performance checks are unlikely to keep up with the growing pace of code changes.
The goal is “simple”: make performance regression testing something you can forget about until something goes wrong.
I’m using hotpath-rs profiler to profile itself. Since the beta release of hotpath-cloud I’ve gathered almost 2k benchmark reports from the project’s repo. This dataset provides interesting insights not only into the performance of the lib, but also into the CI benchmarking environment it runs in.
So let’s start by analyzing the performance noise and variance in GitHub CI runners.
Why benchmarks are noisy on GitHub Actions runners
The following analysis was performed using the hotpath-cloud MCP and CLI integrations. It provides read-only access and querying capabilities for public benchmark reports from integrated repositories.
hotpath-rs uses a set of benchmarks to monitor its critical performance aspects. Some are designed to execute a 100% fixed workflow. The drain benchmark measures the overhead of gathering 1 million profiling signals. It sends them to the background thread for processing, using a custom ring buffer data structure from the hotpath-drain crate.
To measure the CI noise in isolation, I’ve opened a pull request that changes no code at all. It runs the same drain benchmark twice, from the same source code and configuration: drain on an x86 runner, and drain-arm on an ARM runner. I then pushed empty commits to this branch until each benchmark was rebuilt and executed 100 times with nothing changed in between.
You can use the hotpath cloud CLI to see the total wall-clock time of each of the 100 x86 runs:
hotpath cloud reports --repo hotpath-rs/hotpath --benchmark drain \
  --pr 817 | jq '[.reports[].totals.elapsed]'
# ["68.32 ms","68.75 ms","83.74 ms","71.73 ms","71.08 ms","67.94 ms", ...]
The benchmark source code and configuration remain unchanged across all 100 runs, yet execution times range from 35 ms to 98 ms, almost a 3x spread!
Part of the reason for this hides in the metadata of the benchmark reports:
hotpath cloud reports --repo hotpath-rs/hotpath --benchmark drain \
  --pr 817 | jq '[.reports[].user_metadata.cpu]'
# ["AMD EPYC 9V74 80-Core Processor","INTEL(R) XEON(R) PLATINUM 8573C",
#  "AMD EPYC 9V74 80-Core Processor","AMD EPYC 7763 64-Core Processor",
#  "Intel(R) Xeon(R) Platinum 8370C CPU @ 2.80GHz", ...]
Have a look at this table generated from the 100 x86 runs of this pull request:
| CPU model | Runs | Share |
|---|---|---|
| AMD EPYC 7763 64-Core Processor | 41 | 41% |
| AMD EPYC 9V74 80-Core Processor | 28 | 28% |
| Intel Xeon Platinum 8573C | 12 | 12% |
| AMD EPYC 9V45 96-Core Processor | 11 | 11% |
| Intel Xeon Platinum 8370C @ 2.80GHz | 7 | 7% |
| Intel Xeon 6973P-C | 1 | 1% |
One reason for the detected variability is that GitHub Actions assigns different CPU models to different runs, with significantly different performance characteristics. But hardware differences aren’t the whole story.
Even among the 41 runs on the same AMD EPYC 7763 CPU model, execution times ranged from 69.73 ms to 89.60 ms, a 1.28x spread.
x86 vs ARM runner variance
In addition to the x86 architecture, GitHub CI also supports ARM runners. That’s what the drain-arm benchmark from the same pull request uses. It’s the same source code and configuration as drain, compiled for ARM instead of x86. Let’s analyze its wall-clock timing across 100 runs:
hotpath cloud reports --repo hotpath-rs/hotpath --benchmark drain-arm \
  --pr 817 | jq '[.reports[].totals.elapsed]'
# ["44.80 ms","30.22 ms","32.12 ms","34.50 ms","29.21 ms","32.43 ms", ...]
And the CPU models it ran on:
hotpath cloud reports --repo hotpath-rs/hotpath --benchmark drain-arm \
  --pr 817 | jq '[.reports[].user_metadata.cpu]'
# ["Neoverse-N2","Neoverse-N2","Neoverse-N2","Neoverse-N2", ...]
99 of these 100 runs got the same Neoverse-N2 CPU model. Across all 100 runs, wall-clock timing ranged from 28.79 ms to 57.37 ms, almost a 2x spread. Because x86 and ARM builds produce different binaries, comparing their absolute execution times would be meaningless.
Interestingly, excluding the single Neoverse-V3 run barely changes the results. The remaining 99 runs on Neoverse-N2 still range from 28.97 ms to 57.37 ms, a 1.98x spread. This demonstrates that using the same CPU model doesn’t eliminate CI timing noise.
Synthetic vs. real-world benchmarks
It’s worth noting that the drain benchmark is not a simple single-threaded computation. It measures cross-thread communication overhead: the measured code pushes profiling events into the ring buffer while a background thread consumes them. That makes it more susceptible to thread scheduling and run-to-run variance than a synthetic benchmark that only crunches numbers on a single thread. But this cross-thread handoff is exactly what hotpath-rs does in production, so it’s the benchmark I actually need to track. Synthetic single-threaded benchmarks produce cleaner numbers, but they rarely represent real-world production workloads.
With timing swinging up to 2-3x between identical runs, wall-clock measurements alone can’t tell a real regression from a noisy runner. They give you nothing stable to iterate on, let alone a reliable signal to gate pull requests. We clearly need a different approach.
Are memory allocations a stable benchmark metric?
In addition to wall-clock timing, hotpath-rs supports per-function allocation metrics. We can observe how much memory was allocated by each instrumented function. Let’s analyze the metrics gathered from drain and drain-arm benchmarks:
hotpath cloud reports --repo hotpath-rs/hotpath --benchmark drain \
  --pr 817 --precise | jq '[.reports[].totals.allocated]'
# ["2425213 B","2425213 B","2425213 B","2425213 B","2425213 B", ...]

hotpath cloud reports --repo hotpath-rs/hotpath --benchmark drain-arm \
  --pr 817 --precise | jq '[.reports[].totals.allocated]'
# ["2425213 B","2425213 B","2425213 B","2425213 B","2425213 B", ...]
All 100 values are exactly 2425213 B on both x86 and ARM, with no variation at all, which makes a clean contrast with the wall-time spread.
And this is how you can check allocations for a specific function:
hotpath cloud reports --repo hotpath-rs/hotpath --benchmark drain \
  --pr 817 --precise \
  --select '{"functions":{"keys":["hotpath_drain::EventProducer::push"]}}' \
  | jq '[.reports[].payload.functions_alloc.data[0].total]'
# ["1216768 B","1216768 B","1216768 B","1216768 B", ...]

hotpath cloud reports --repo hotpath-rs/hotpath --benchmark drain-arm \
  --pr 817 --precise \
  --select '{"functions":{"keys":["hotpath_drain::EventProducer::push"]}}' \
  | jq '[.reports[].payload.functions_alloc.data[0].total]'
# ["1216768 B","1216768 B","1216768 B","1216768 B", ...]
EventProducer::push also allocates exactly 1216768 B in every run, regardless of the CPU model or architecture.
This leads to a core insight:
Well-designed benchmarks can be 100% deterministic in terms of memory allocations, even on shared GitHub runners.
While not always true, allocations can be a very decent proxy for assessing the overall performance of your codebase. More work usually translates to more memory churn, and optimizations often manifest as reduced memory usage.
But relying on allocations alone can be deceiving. Have a look at the following example. This one goes to all the LeetCode fans out there:
#[hotpath::measure]
fn dedup(values: &[u64]) -> Vec<u64> {
    let mut unique = Vec::new();
    for &value in values {
        if !unique.contains(&value) {
            unique.push(value);
        }
    }
    unique
}
It’s a classic problem of designing an algorithm for removing duplicate values from an array.
And here is an optimized version:
#[hotpath::measure]
fn dedup(values: &[u64]) -> Vec<u64> {
    let mut seen = HashSet::new();
    let mut unique = Vec::new();
    for &value in values {
        if seen.insert(value) {
            unique.push(value);
        }
    }
    unique
}
Comparing these two versions with hotpath-cloud produces the following report:
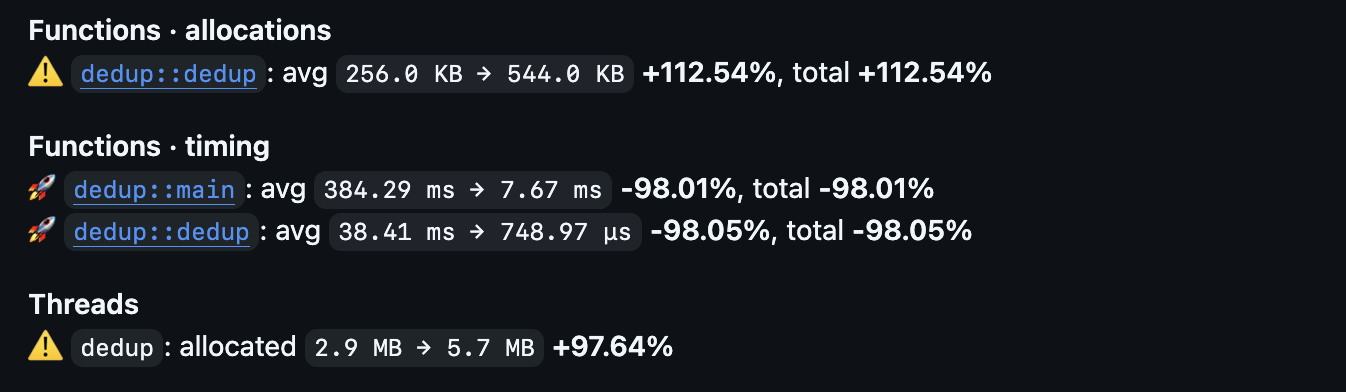
So while allocations went up by >2x, timing dropped by 98%. This example is exaggerated on purpose, but it clearly shows that while allocations can be a decent proxy in many cases, in some they can be completely misleading and don’t replace timing measurements.
Where does it leave us? Timing is unreliable on shared CI runners, and the usefulness of allocations ranges from a decent proxy to completely misleading.
Luckily for us, there’s a third way to look at our Rust apps’ performance.
Counting CPU instructions with Callgrind
Coming from Ruby on Rails backend development, I have to admit I’ve only recently learned about the existence of Valgrind.
While researching ways to make hotpath-rs performance reports more deterministic and comparable, some users suggested using hardware performance counters. These can measure CPU instructions, cache misses, and other metrics that are less sensitive to system load than wall-clock timing.
Unfortunately, hardware performance counters aren’t reliably available on GitHub-hosted runners, which is where most of our benchmarks run.
That’s what led me to Valgrind and its Callgrind profiler, which can count executed instructions through software instrumentation, without relying on hardware performance counters.
Callgrind-based regression testing isn’t a new idea. Gungraun (formerly iai-callgrind) and CodSpeed already offer instruction-count benchmarking, while Bencher provides continuous performance regression tracking. What I wanted to achieve with hotpath-rs was something slightly different: combining CPU instruction counts, native timing, and allocations into a single report, with detailed metrics and configurable performance budgets for individual instrumented functions. The hotpath-cloud CI and MCP integrations make these metrics accessible to developers and AI agents.
Here’s the full diff of our dedup example with the icount (hotpath-rs name for Callgrind Ir - instructions read) metric included:
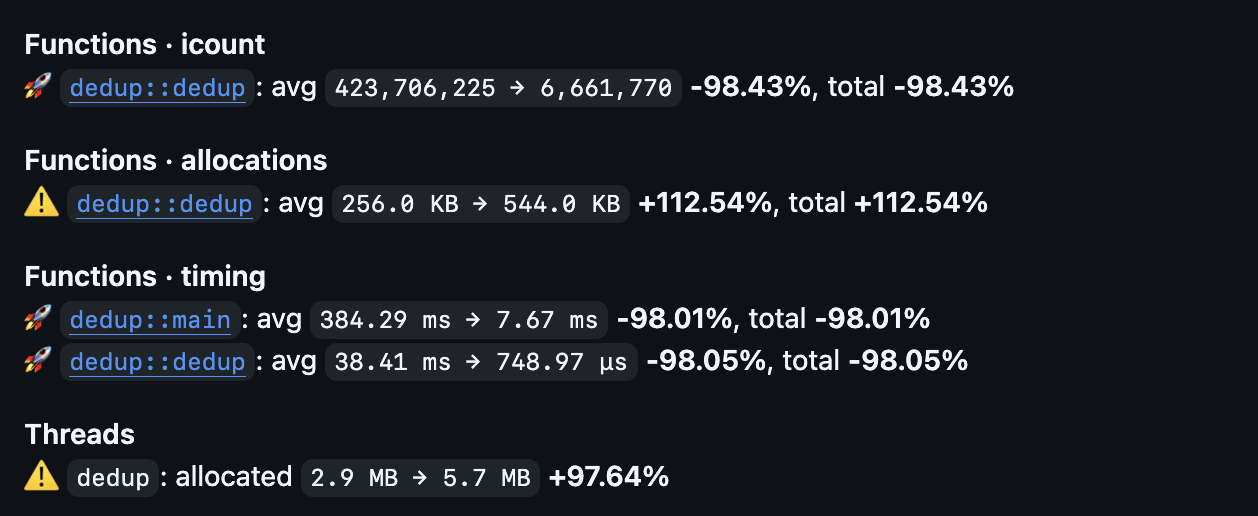
In this example, instruction counts and wall-clock timing improve by almost the same amount. However, instruction counts aren’t a direct measure of execution time, as we’ll discuss later. Now let’s have a look at their variance:
hotpath cloud reports --repo hotpath-rs/hotpath --benchmark drain \
  --pr 817 | jq '[.reports[].totals.icount]'
# ["424799737","424740325","424709712","424801754", ...]
And the same for ARM:
hotpath cloud reports --repo hotpath-rs/hotpath --benchmark drain-arm \
  --pr 817 | jq '[.reports[].totals.icount]'
# ["418121664","418120637","418294947","418111505", ...]
And this is how you can check instruction counts for a specific function:
hotpath cloud reports --repo hotpath-rs/hotpath --benchmark drain \
  --pr 817 \
  --select '{"functions":{"keys":["hotpath_drain::EventProducer::push"]}}' \
  | jq '[.reports[].payload.functions_icount.data[0].total]'
# ["26482238","26482238","26482141","26482044", ...]
So while wall-clock timing varies up to 3x on x86 and 2x on ARM, total instruction counts vary by only ~0.13% on x86 and ~0.065% on ARM, regardless of which CPU model GitHub assigned to the run. Individual functions can vary more or less than the total, depending on what they do. It’s not 100% deterministic like allocations, but the variability is orders of magnitude smaller than what we observed for wall-clock timing.
So let’s sum up where we are now. Each metric has its own strengths and weaknesses:
- Wall-clock timing is what your users actually experience, but on shared CI runners it’s too noisy to judge on its own. It can still be used to spot large regressions and give context to the other metrics.
- Allocations are 100% deterministic for a well-designed benchmark, but as the
dedupexample showed, they’re only a proxy for performance, and sometimes a misleading one. - CPU instruction counts are very close to deterministic and closely track the actual work a function does. But they don’t represent real clock time: an instruction that misses the cache costs far more than one that hits it, while Callgrind’s
Irmetric counts both equally. Valgrind also serializes thread execution, so multithreaded benchmarks behave differently under Callgrind than they do natively. This is another reason to interpret instruction counts alongside native timing rather than treating them as equivalent measurements.
What matters is that these metrics augment each other. hotpath-rs CI integration guide explains how to configure GitHub Actions to run the same binary under Callgrind and later merge the simulated icount metrics with allocation and wall-clock timing data from the native run.
So a single hotpath-rs report can show that a function now executes fewer instructions, how many bytes it allocates, and what its average execution time was. Even if the timing varies between runs, it still gives you valuable context for interpreting the more deterministic metrics.
When Callgrind instruction counts mislead: cache locality
icount might seem like the holy grail of performance regression tracking: almost 100% deterministic on every platform. Unfortunately, this is not the case. With the help of my AI friends, I came up with an example demonstrating how icount can be misleading. Have a look at these hotpath-cloud report results:
| Function | Calls | Icount (avg) | Wall-clock (avg) |
|---|---|---|---|
cache::cache_sequential | 5 | 20,971,545 | 5.06 ms |
cache::cache_random | 5 | 20,971,545 | 133.04 ms |
| Difference | 0% | +2529% |
Both functions execute the same number of instructions and differ only in cache locality. The Ir instruction-count metric doesn’t account for cache locality, so both functions report identical instruction counts despite a ~26x difference in wall-clock timing. Callgrind can also simulate cache misses using --cache-sim=yes, but hotpath-rs doesn’t expose these metrics yet.
So whenever performance depends on cache locality (data layout, pointer chasing, hash maps vs. arrays), icount can be completely misleading. It’s a great deterministic signal for how much work your code does, but it is not a substitute for wall-clock timing.
The hotpath-rs Callgrind integration is brand new. In future releases, I’m planning to integrate more simulation metrics exposed by the tool, to account for different scenarios and make it easier to catch similar misleading cases.
One caveat for ARM users: Callgrind’s ARM support has some known limitations. During testing, I encountered incorrect instruction count attribution and ended up using a (highly experimental!) Valgrind fork to address the issue.
Adding deterministic metrics to existing Criterion benchmarks
With all the discussion about run-to-run variance, maybe you kept thinking “why not Criterion?”. criterion.rs is a well-known Rust benchmarking library designed to deal with exactly this kind of noise. It runs each benchmark many times, flags outliers, and only reports a change as a regression or improvement when it’s statistically significant.
Criterion’s statistical analysis helps deal with timing variability within a benchmark run. But when the baseline and PR benchmarks execute in separate CI jobs, potentially on different CPU models, a statistically significant difference can reflect hardware differences rather than an actual code regression. And as we saw earlier, even runners with the same CPU model can exhibit substantial timing variability.
Criterion’s own docs are upfront about it. Their answer to how to run Criterion benchmarks in a CI pipeline is “You probably shouldn’t (or, if you do, don’t rely on the results)”, because the noise from cloud CI virtualization is more than its statistical analysis can mitigate. Instead, they suggest counting instructions under a Valgrind tool, which a slowed-down or paused VM can’t throw off.
If you’ve ever benchmarked your Rust project, you likely already have a set of Criterion benchmarks in your codebase. hotpath-rs recently added a first-class Criterion.rs integration that collects Callgrind instruction counts for them, alongside wall-clock timing and allocations. It requires minimal code changes (criterion::Bencher becomes hotpath::criterion::Bencher etc.). Setting HOTPATH_CRITERION_ITERATIONS runs the selected benchmark routine a fixed number of times in Criterion’s test mode, so every run performs exactly the same work.
So while default Criterion provides statistically significant info on global wall-clock timing, the hotpath-rs integration augments it with detailed metrics for each instrumented resource. I invite you to give it a try. The hotpath-cloud integration already has a few early adopters, with Freya among them. Their preexisting Criterion benchmarks (running on x86) report the following variance metrics. The wall-clock spread here measures hotpath-rs native execution time with a fixed number of Criterion iterations, not Criterion’s own statistical mean estimate:
| Benchmark (100 runs, Nov 2-9) | Wall-clock spread | Allocations spread | Icount spread |
|---|---|---|---|
torin-criterion-aligned-8 | 3.00x | 0% | 0.004% |
torin-criterion-binary-12 | 2.04x | 0% | 0.001% |
torin-criterion-wide-5-cached | 2.35x | 0% | 0.012% |
Wall-clock timing still varies 2-3x between runs, but allocations and instruction counts stay rock solid. These results demonstrate the stability of the additional hotpath-rs metrics, not the accuracy of Criterion’s statistical comparison. They show that you can significantly improve the granularity of metrics gathered from your existing Criterion benchmarks, and upload them to hotpath-cloud for further analysis, with minimal development overhead.
And you don’t even have to do it by hand. The hotpath-rs agent skill lets your AI agent instrument the benchmarks, configure the CI workflow, and later analyze and help fix the reported regressions:
npx skills add hotpath-rs/hotpath --skill hotpath-rs
Performance regression policies and budgets
We’ve established that every performance metric has its limitations. Wall-clock timing can vary significantly between CI runs, allocations are sometimes misleading, and instruction counts don’t capture every aspect of real-world performance.
So how do we turn these measurements into reliable automated regression checks?
hotpath-cloud supports configurable regression policies and performance budgets. Each benchmark can define which metrics should be evaluated, how large a change must be before it’s considered a regression, and whether that regression should fail the pull request check.
For example, here’s a simplified version of the policy I use for the drain benchmark:
[functions]
min_percent_total = 0.5

[[functions.budgets]]
match = "hotpath_drain::EventProducer::push"
alloc = { avg = "2 B", total = "1.5 MB" }
calls = { min = 1000000, max = 1000000 }

[functions.alloc]
judged = true
min_percent_change = 2
metrics = ["avg", "total"]
min_calls = 0

[functions.icount]
judged = true
min_percent_change = 3
metrics = ["avg", "total"]
min_calls = 0

[functions.timing]
judged = false
This configuration combines two approaches to detecting regressions.
Performance budgets define absolute limits. In this example, EventProducer::push must execute exactly one million times, while staying within specified memory allocation limits. Violating these budgets fails the PR check.
Relative regression thresholds compare the current results against the baseline. Allocation regressions exceeding 2% can fail the check. Instruction-count changes exceeding 3% are reported, but don’t fail it with this configuration.
min_percent_total = 0.5 skips functions that account for less than 0.5% of the run, so small helpers can’t trigger alerts on measurement noise.
Wall-clock timing is deliberately excluded from regression judgments because of the CI variability we measured earlier. It’s still included in the report, providing additional context without triggering false regression alerts.
These thresholds are specific to this benchmark, not universal recommendations. For example, the drain benchmark involves multiple threads, and its instruction counts vary slightly depending on thread scheduling. A single-threaded benchmark might support much stricter thresholds.
The idea is to make performance checks configurable enough to distinguish meaningful regressions from expected measurement noise.
The CI integration guide covers setting up GitHub Actions and configuring regression policies in more detail.
Real Rust optimizations verified in CI
To wrap up, here are two recent hotpath-rs optimizations, each confirmed by deterministic metrics in CI.
Unbounded ring-buffer implementation
An improvement to the hotpath-drain ring buffer implementation: PR #720 and related hotpath-cloud diff report:
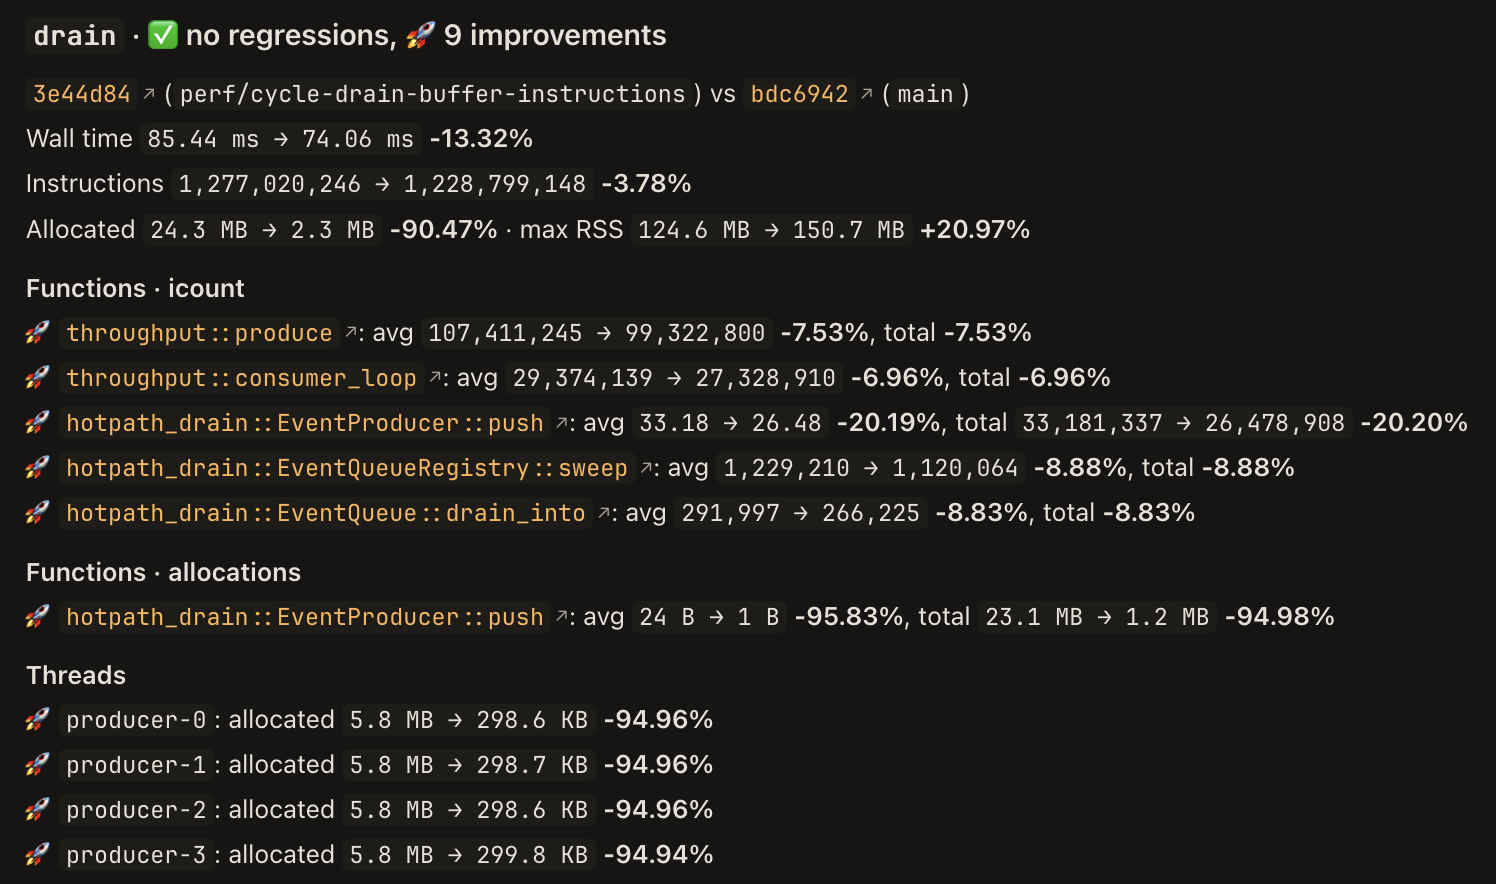
Changing the ring buffer implementation to an unbounded one that reuses memory chunks resulted in a ~95% reduction in allocation churn and a ~7-20% reduction in CPU instructions per instrumented function, with the largest drop in EventProducer::push.
Avoid exponential future growth in nested async functions
A fix for async future size growth in nested #[hotpath::measure] functions: PR #801 and related hotpath-cloud diff report:
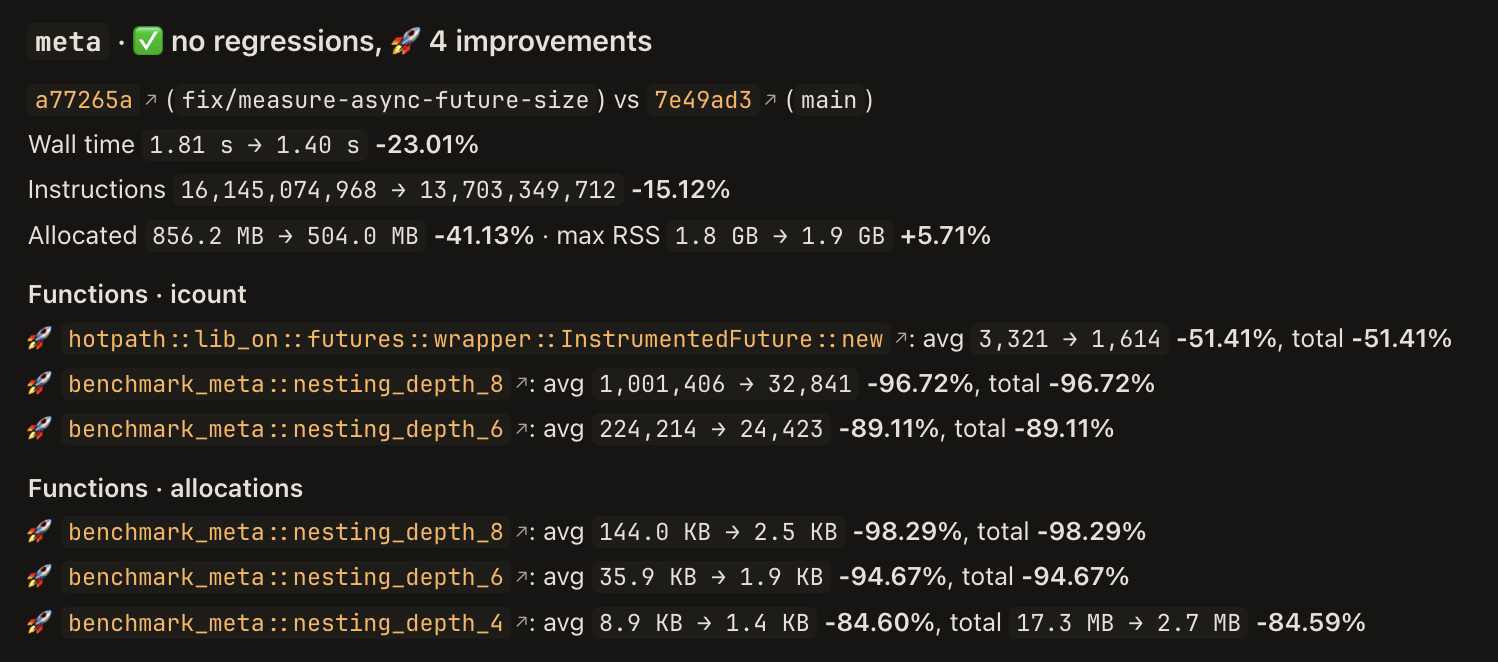
Each measured async fn used to store the wrapped future 2-3 times, so the outer future grew exponentially with every nesting level. Replacing the async fn wrappers with a hand-written MeasuredFuture keeps the size linear. For 8 levels of nesting, it resulted in a ~98% reduction in allocations and a ~97% reduction in CPU instructions.
The growing set of deterministic benchmarks lets me iterate on new hotpath-rs features, often with AI assistance, while staying confident that none of the core performance invariants break. The CI checks enforce the configured performance budgets and report potential regressions before they get merged.
Library adoption and future plans
Every profiling feature and hotpath-cloud itself get tested on the hotpath-rs codebase first. Using the tool to build itself shapes the API design and helps me explore new ways to make it more useful.
The recently released hotpath-cloud MCP integration lets your AI agent query the benchmark reports and diffs directly, so the whole find, fix and verify loop can be automated.
One promising approach I’m currently experimenting with is running baseline and pull request benchmarks on the same GitHub Actions runner. This could significantly reduce timing variability caused by differences in the underlying hardware. Early results look encouraging, particularly on x86 runners, but there are still challenges around CI execution time and securely handling forked pull requests. I’ll explore this approach in more detail in upcoming articles.
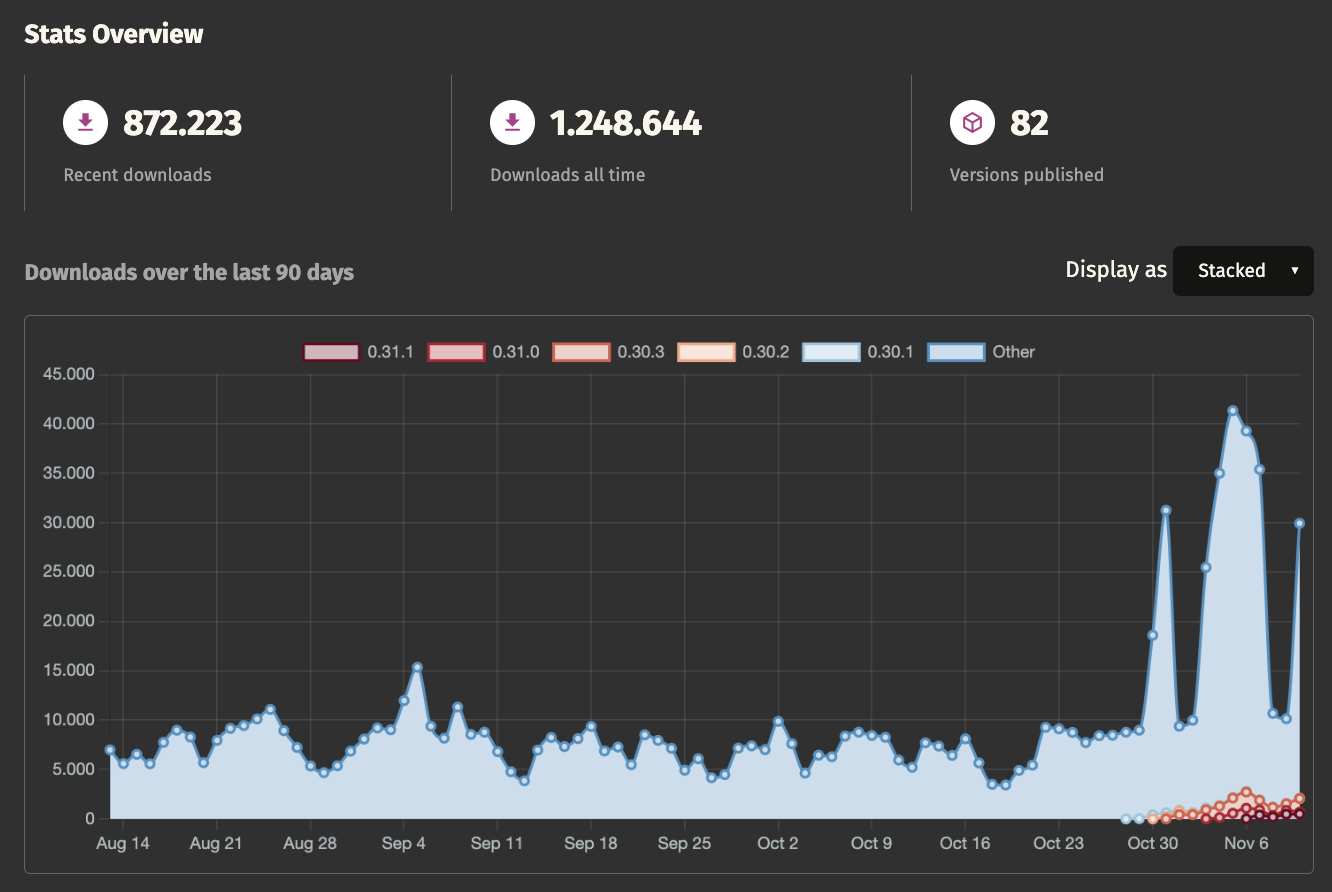
Recently, the open-source hotpath-rs crate reached 1 million total downloads, and for the first time crossed 40k downloads in a single day:
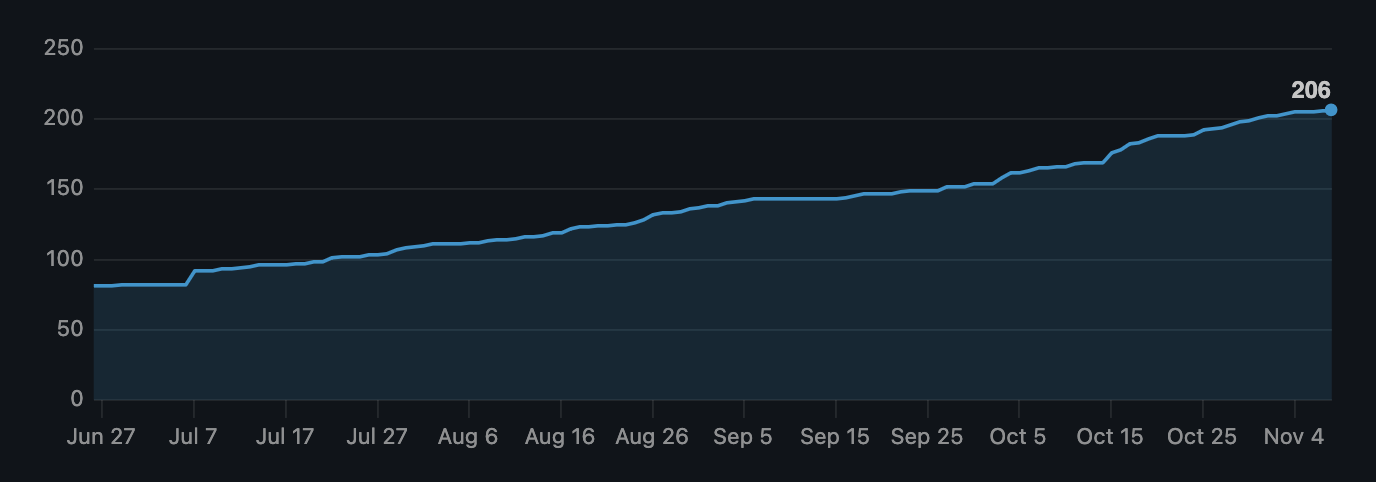
Already over 200 open-source projects integrate the library, including big players like RustFS and PostHog:
If you’d like to start catching Rust performance regressions in CI, I invite you to give hotpath-cloud a try. It’s currently free, and public repositories will remain free after beta ends.
I’m looking forward to continuing work on the library and excited to see where the Rust community takes it next.
Summary
Thanks for making it to the end of this long post! The main takeaway is that no single metric can reliably detect every performance regression. Wall-clock timing, memory allocations, and CPU instruction counts each have limitations. But combining them provides a much more reliable picture of how your code’s performance changes over time.
This is all a work in progress, at the beta and MVP stage. I’m looking forward to sharing more updates from the Rust performance optimization trenches soon, so stay tuned for that. In the upcoming blog post, I’ll cover configuring your own bare-metal runners with GitHub Actions, and how it impacts benchmark stability. Spoiler alert: it does.
Enjoyed this post? ⭐
If you found it useful, consider giving hotpath-rs a star on GitHub. It helps more Rust developers discover the project.
