How to Fix PostgreSQL Performance Issues with PG Extras
Published: September 28, 2020
Reading time: 16 minutes
hotpath-rs profiles CPU, memory, async execution, channels and locks contention. SQL, HTTP and regression detection are coming next.
PostgreSQL database queries are a common performance bottleneck for web apps. Before you resort to more complex optimization techniques like caching or read replicas, you should double-check if your database engine does not need tuning and queries are not underperforming.

PG Extras is a tool that allows you to spot common PostgreSQL pitfalls. Rails, Rust and Elixir implementations are currently available.
In this blog post, I present a step by step guide on using PG Extras library to spot and resolve common PostgreSQL database performance issues.
How to start using PG Extras
Please refer to READMEs of respective implementations for installation details. API is almost identical for all the versions. Let’s compare the invocation of the cache_hit method:
RailsPGExtras.cache_hit # Rails
EctoPSQLExtras.cache_hit(YourApp.Repo) # Elixir
pgextras cache_hit # Rust CLI
In this blog post, I’ll be using examples from the Rust CLI. You can install it with Cargo:
cargo install pg-extras
Then point it at your database using the DATABASE_URL env variable:
export DATABASE_URL="postgresql://postgres:secret@localhost:5432/database_name"
Enable pg_stat_statements extension
Some of the PG Extras methods depend on the pg_stat_statements extension. If you are using a default Heroku PostgreSQL plugin or AWS RDS, you should be good to go without making any changes.
To check if the extension is already enabled you can use PG Extras itself:
pgextras extensions

...
| pg_stat_statements | 1.7 | 1.7 | track execution statistics of all SQL statements executed
...
If pg_stat_statements is not listed you should check out these docs for info on installing it.
If the extension is available but not enabled you have to run this SQL command in your database:
CREATE EXTENSION IF NOT EXISTS pg_stat_statements;
Now that you’ve installed the CLI let’s start checking our database’s health.
[Important] Make certain to run all the checks on a warmed up production database. Under the hood, PG Extras performs a lightweight queries on PostgreSQL metadata tables. It will not impact your production workload.
1) Validate your database specs with cache hit ratios
In theory, the simplest solution to optimize the underperforming database is to scale it up vertically. Before you start throwing money at your performance issues, it’s good to check if it will actually help.
PostgreSQL tracks access patterns of your data and keeps frequently read chunks in a memory cache. A reliable indicator that a database should be scaled up is an invalid cache hit ratio.
You can check index and table cache hit ratios using the following code:
pgextras cache_hit

      name      |         ratio
----------------+------------------------
 index hit rate |        0.999577
 table hit rate |        0.988721
If you want to drill down into each individual’s table and index cache hit ratios, you can use the table_cache_hit and index_cache_hit commands. The rule of the thumb is that values should be above 99%. If your database cache hit ratios are lower, it’s either not correctly configured or should be scaled up to increase the performance.
On Heroku you can double-check if the memory is missing by running the following command:
heroku logs -t | grep heroku-postgres
After a few moments, you should see the PostgreSQL plugin logs output. You have to look for the following entries:
sample#memory-total=62560050kB sample#memory-free=11327524kB
I usually try to keep around ~30% of total memory free. Unfortunately, on Heroku, you’d have to write a custom script to monitor this metric and alert you when the numbers are off. On the contrary, AWS RDS comes with full-blown CloudWatch support. You can easily configure alerts if memory usage is not correct. That’s just one of the reasons why you might want to consider migrating your PostgreSQL from Heroku to RDS. Check out this blog post for more details.
As for the PG settings, Heroku PostgreSQL ships with already optimized values and does not allow you to change them. Amazon RDS is known for shipping database instances with incorrect default settings. If you’re using it, make sure to tweak them before deciding to scale up the instance. PGTune is the best tool to help you tweak the most important Postgres buttons and dials to the correct values.
You can use the db_settings command to check current values of PGTune related settings:
pgextras db_settings


|              name            | setting | unit |
+------------------------------+---------+------+
| checkpoint_completion_target | 0.7     |      |
| default_statistics_target    | 100     |      |
| effective_cache_size         | 1350000 | 8kB  |
| effective_io_concurrency     | 1       |      |
| maintenance_work_mem         | 1740800 | kB   |
| max_connections              | 500     |      |
| max_wal_size                 | 2048    | MB   |
| min_wal_size                 | 80      | MB   |
| random_page_cost             | 2       |      |
| shared_buffers               | 374912  | 8kB  |
| wal_buffers                  | 2048    | 8kB  |
| work_mem                     | 102400  | kB   |
+------------------------------+---------+------+
2) Remove unused indexes
Overusing indexes is a recipe for a sluggish web app.
The more indexes you add, the more write operations have to be performed on each data update. Misconfigured indexes also tend to unecessarily bloat the size of a database, slowing down the backup/restore/upgrade operations.
It’s entirely possible that some of your indexes and not used and can be safely removed.
PG Extras unused_indexes command can help you spot them:
pgextras unused_indexes

          table      |                       index                | index_size | index_scans
---------------------+--------------------------------------------+------------+-------------
 public.grade_levels | index_placement_attempts_on_grade_level_id | 97 MB      |           0
 public.observations | observations_attrs_grade_resources         | 33 MB      |           0
 public.messages     | user_resource_id_idx                       | 12 MB      |           0
Few index_scans on an index that has been around for a while means that you should probably remove it. One catch here is indexes on smaller tables. A PostgreSQL query planner might not use them because so-called sequential scan is more efficient for small collections. You can check out my other blog post about using EXPLAIN ANALYZE to debug PostgreSQL indexes. It describes practical tips e.g, how to force query planner to use an index even for a small development dataset.
If the index is large, remember to use the CONCURRENTLY option when dropping it, to avoid exclusively blocking the whole related table.
index_size command can give you a quick overview of how much space your database indexes are taking:
pgextras index_size

     name            |  size
-----------------------------------------------
 index_a_name        | 5196 MB
 index_b_name        | 4045 MB
 index_b_name        | 2611 MB
However, I recommend double-checking the random_page_cost setting value before removing any indexes. The default value of 4 causes the query planner to prefer sequential scans over indexes. If the database is still using the default value, you can first save the current list of unused indexes, update random_page_cost as recommended by PGTune, let the database run for a few hours under a production load, and later recheck the unused_indexes output. This approach will allow you to see how many indexes were “activated” by this change. While conducting my Rails performance audits, I’ve observed measurable performance improvements due to changing random_page_cost from 4 to 1.1.
3) Optimize “NULL” indexes
By “NULL” indexes, I mean ones that contain a high ratio of NULL values.
In some cases (e.g., indexing foreign keys of an optional relation), NULL values unnecessarily bloat the index size and slow down insert operations on a related table. You can use the null_indexes command to list indexes that contain NULL values:
pgextras null_indexes

      index          | index_size | unique | indexed_column | null_frac | expected_saving
---------------------+------------+--------+----------------+-----------+-----------------
users_reset_token_ix | 1445 MB    | t      | reset_token    |   97.00%  | 1401 MB
plan_cancelled_at_ix | 539 MB     | f      | cancelled_at   |    8.30%  | 44 MB
users_email_ix       | 18 MB      | t      | email          |   28.67%  | 5160 kB
In this example, the users_reset_token_ix index consists primarily of NULLs. Replacing it with a partial one that excludes NULL values will save over 1GB of disk space. You can do it by running the following SQL:
DROP INDEX CONCURRENTLY users_reset_token_ix;

CREATE INDEX CONCURRENTLY users_reset_token_ix ON users(reset_token)
WHERE reset_token IS NOT NULL;
Make sure to check if you’re not querying by NULL values before applying this change.
Reindexing with excluded NULL values is not only about saving disk space. A partial index has to be refreshed only if an updated row matches a provided condition. In my performance audits, I’ve observed a reduction in database locks duration and numbers as a result of removing NULL values from indexes on frequently updated tables.
You can read this blog post for more in-depth info about this technique.
4) Add missing indexes
Now that we’ve removed unused and “NULL” indexes, let’s add some new ones. We don’t want them to share the fate of their recently deprovisioned cousins. Let’s look at PG Extras seq_scans and calls commands before deciding on what should be indexed.
A sequential scan is an action that Postgres performs if it cannot find an index necessary to fulfill the query condition. For the following query:
SELECT * FROM USERS WHERE AGE = 18;
the related EXPLAIN ANALYZE query output will show Seq scan on users Filter: AGE = 18 or Index Scan using users_age_index Index Cond: AGE = 18 depending on whether the index on age column is present or not.
seq_scans command displays the number of Seq Scan operations for each table:
pgextras seq_scans

               name                |  count
-----------------------------------+----------
 learning_coaches                  | 44820063
 states                            | 36794975
 grade_levels                      | 13972293
 charities_customers               |  8615277
Now that we know which tables are often read inefficiently, we can use the calls and outliers commands to list the most often executed and most time-consuming queries. If your app is written in Rust, you can complement this server-side view by profiling sqlx or diesel SQL queries straight from the application, grouping executions by normalized statement to surface the most frequent and slowest queries.
Both of those commands let you extract the raw query string. You can use it to perform EXPLAIN ANALYZE and check if the query planner does Seq scan on one of the tables.
By correlating all those sources of data, you should be able to spot queries that are consuming a lot of your database resources and are potentially missing an index.
Watch out to avoid premature optimization by adding unnecessary indexes. PostgreSQL will often fallback to Seq Scan instead of Index Scan on small tables, for which using the index would be less efficient than reading the whole table row by row.
5) Identify deadlocks
PostgreSQL uses locks to ensure data consistency in multithreaded environments. There are different kinds of locks, but we’ll focus on ExclusiveLock and RowExclusiveLock. A healthy web app should never lock for more than a couple of hundred of miliseconds.
Deadlock is two more or database locks blocking each other and not able to continue execution. An implementation error that results in a deadlock might have disastrous consequences for your application. The queue of requests not able to proceed could start piling up and eventually crash your servers.
Common reasons for deadlocks and locks that are granted for too long:
- too broad database transaction scope
- adding or removing index without using the
CONCURRENTLYoption - updating lots of rows at once
- adding a new column with the default value (before PostgreSQL 12)
How to detect locks and deadlocks
You can use the locks command to see all the currently obtained locks together with the source query:
pgextras locks

 procpid | relname | transactionid | granted |     query_snippet     | mode             |       age
---------+---------+---------------+---------+-----------------------+-------------------------------------
   31776 |         |               | t       | <IDLE> in transaction | ExclusiveLock    |  00:19:29.837898
   31776 |         |          1294 | t       | <IDLE> in transaction | RowExclusiveLock |  00:19:29.837898
   31912 |         |               | t       | select * from hello;  | ExclusiveLock    |  00:19:17.94259
    3443 |         |               | t       |                      +| ExclusiveLock    |  00:00:00
The mere presence of locks does not mean that something is wrong with your database. Only locks that are granted for too long are potentially problematic. If you’re using Rails, you can use the following snippet integrated into a background job to alert you if this happens:
TRESHOLD_SECONDS = 1

long_locks = RailsPGExtras.locks(in_format: :hash).select do |lock|
  Time.parse(lock.fetch("age")).seconds_since_midnight > TRESHOLD_SECONDS
end

raise "Long running locks: #{long_locks}" if long_locks.present?
[Update] I’ve wrapped this technique in an easy-to-use pg-locks-monitor gem. I invite you to check it out if you’re using a Rails-based stack.
If you notice extended locks, you can use the blocking command to check which SQL statements cannot continue execution because of a lock:
pgextras blocking

 blocked_pid |    blocking_statement    | blocking_duration | blocking_pid |                                        blocked_statement                           | blocked_duration
-------------+--------------------------+-------------------+--------------+------------------------------------------------------------------------------------+------------------
         461 | select count(*) from app | 00:00:03.838314   |        15682 | UPDATE "app" SET "updated_at" = '2013-03-04 15:07:04.746688' WHERE "id" = 12823149 | 00:00:03.821826
If your app is crashing because of deadlocks, you can use the kill_all to terminate all the database processes before you manage to resolve the underlying cause.
6) Get rid of unnecessary bloat
The way PostgreSQL works is that it never updates or removes the data in place but instead marks each row as visible or not for transactions using two meta columns xmin and xmax. Rows no longer visible for any of the currently active transactions are called dead rows or bloat.
Dead rows are regularly garbage collected by a process called AUTOVACUUM, and space they previously occupied can be reclaimed for new data. If autovacuuming is misconfigured, it might result in your table consisting of mostly dead rows that are blocking the disk space and slowing down queries.
To check if some of your tables are overly bloated, you can use the bloat command:
pgextras bloat

 type  | schemaname |           object_name         | bloat |   waste
-------+------------+-------------------------------+-------+----------
 table | public     | bloated_table                 |   8.1 | 98 MB
 table | public     | other_bloated_table           |   1.1 | 58 MB
 table | public     | clean_table                   |   0.2 | 3808 kB
 table | public     | other_clean_table             |   0.3 | 1576 kB
If bloat ratio (i.e. size of bloat related to the size of the whole table) is close to the value of 10 you should have a closer look at your vacuum settings. vacuum_stats command can help you with that:
pgextras vacuum_stats

 schema |         table         | last_vacuum | last_autovacuum  |    rowcount    | dead_rowcount  | autovacuum_threshold | expect_autovacuum
--------+-----------------------+-------------+------------------+----------------+----------------+----------------------+-------------------
 public | bloated_table         |             | 2020-04-26 17:37 |            100 |            810 |           3000       |
 public | other_bloated_table   |             | 2020-04-26 13:09 |             79 |             98 |            166       |
 public | clean_table           |             | 2020-04-26 11:41 |             41 |             11 |             58       |
 public | other_clean_table     |             | 2020-04-26 17:39 |             12 |              4 |             52       |
On frequently updated tables the bloat could be significant but autovacumming should be getting rid of it on a regular basis.
If you see that your bloated table has not been autovacuumed for a while and autovacuum is not expected, it means that something might be misconfigured in your autovacuum settings. You should check the PostgreSQL docs on automatic vacuuming for more info on config settings that could cause that.
To VACUUM FULL or not
If your table has bloat, although vacuum_stats indicate that it has recently been vacuumed, it means that table has a lot of free disk space that has been previously restored from the vacuumed rows.
It is not necessarily a bad thing. PostgreSQL will reuse that disk space for new data. If you’d like to reclaim this space for the operating system, you need to perform the VACUUM FULL. Contrary to VACUUM the VACUUM FULL grants an exclusive table lock, so doing it on a live production database could cause a disaster.
To perform VACUUM FULL without locking the underlying table, you could use pg_repack.
Generally, it is not recommended to run VACUUM FULL on a regular basis. You should consider it only in some cases, i.e., you’ve removed most of the data from a huge table.
7) Remove unneeded objects
It might seem like obvious advice, but I have a feeling that it is often getting overlooked. Do you really need to keep all the data of a user who signed up two years ago and has not visited ever since? Regularly purging unnecessary data will keep both your database and GDPR inspectors happy.
table_size command can help you get a quick overview of how big your tables actually are:
pgextras table_size

            name             |  size
---------------------------------------+
 learning_coaches            |  196 MB
 states                      |  145 MB
 grade_levels                |  111 MB
 charities_customers         |   73 MB
 charities                   |   66 MB
E.g., in my project Abot I regularly remove all the data of teams who deactivated the Slack integration. This is both performance and GDPR friendly practice.
Diagnose your database
I understand that manually checking all those stats can be a tedious and repetitive task. The CLI features a diagnose command that generates a report highlighting potential issues in your database.

This info by itself is usually enough to localize the cause of a problem. But, other lower-level API calls allow you to dive into more details if necessary.
Summary
This checklist should help you keep your Postgres databases running at their best possible performance. PostgreSQL offers powerful insights into what’s going on inside the engine. But, information is scattered across several and sometimes obscure meta tables. PGExtras library is my take on making it more accessible for devs that don’t specialize in databases. I hope you’ll find it useful for debugging your project.
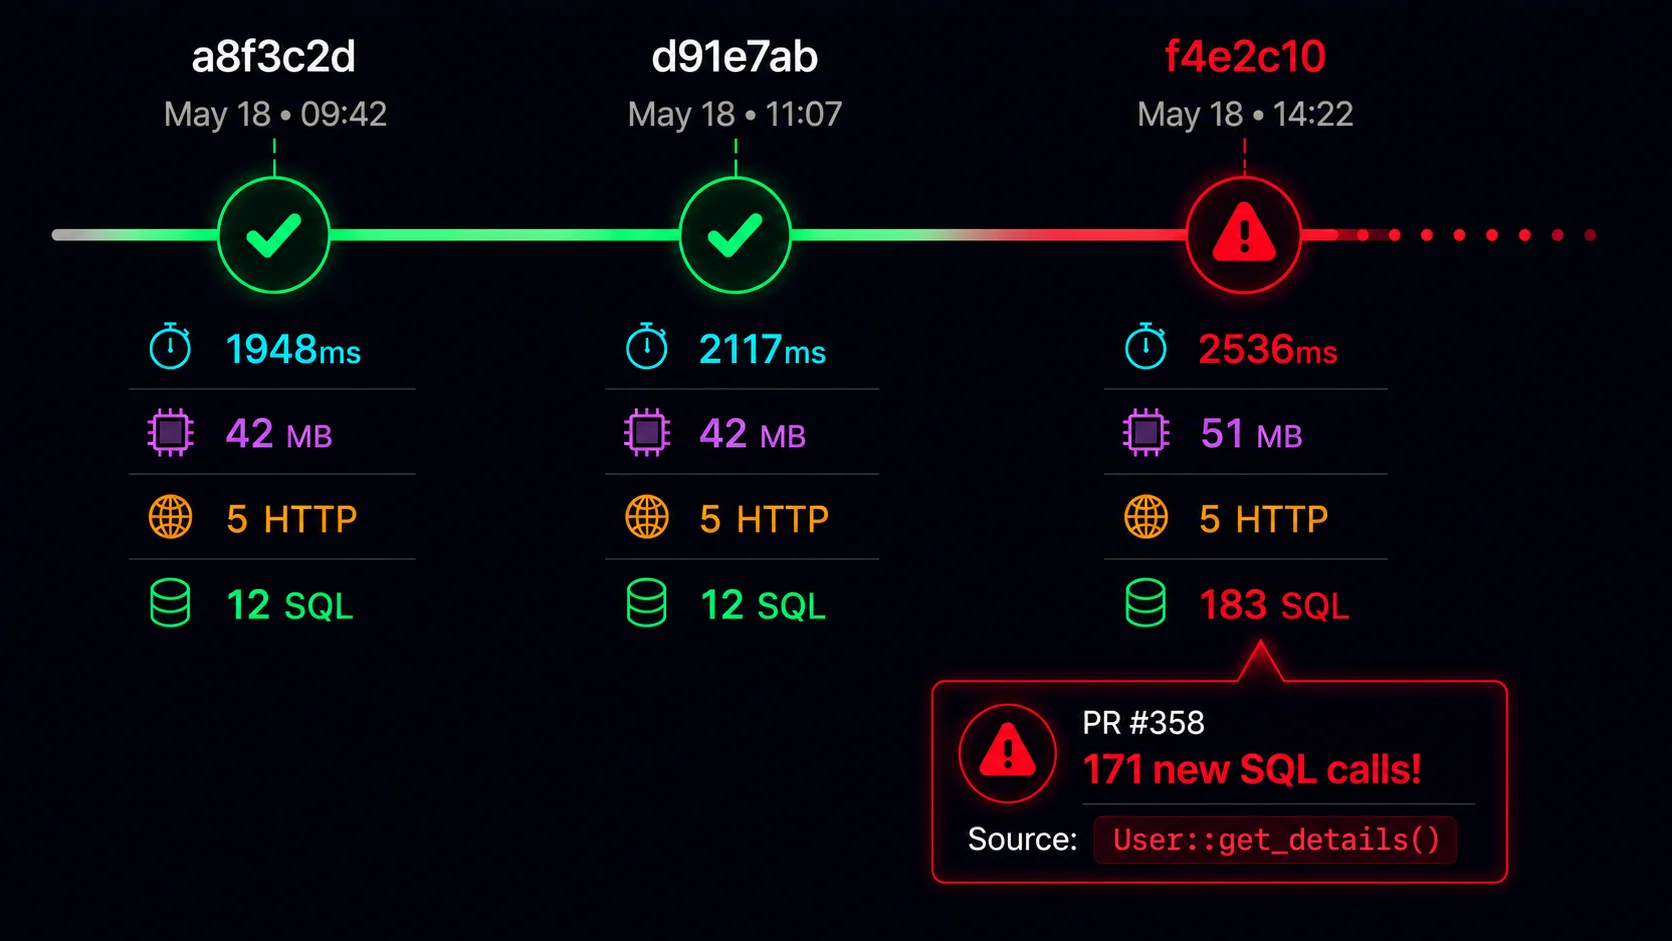
Every Rust PR gets a performance review.
Catch regressions in memory, SQL queries, HTTP calls and concurrency bottlenecks before they reach production. Iterate on reproducible signals, not CI noise.
Launching soon • Early access invitations will be sent to waitlist members first.
Building in public. Follow development progress on X: @_pawurb