How to Track Down and Fix Performance of Slow SQL Queries
Published: March 12, 2018
Reading time: 7 minutes
hotpath-rs profiles CPU, memory, SQL, async execution, channels and lock contention.
 Explore hotpath-rs →
Scaling issues are great because it means that you have traffic on your website. Before you decide that your database “doesn’t scale!” and start a rewrite to a tech stack with potentially more performance, maybe you should double check queries that your PostgreSQL database executes. Below I describe some tools and techniques you can use to track down, diagnose and optimize slow SQL query execution.

Problem with ORMs
I’ve started my programming career developing web apps with ORM libraries. Thanks to them I could start getting stuff done right away.
An ORM lets you write fairly complex database queries without understanding the underlying SQL. It is its best feature and the greatest sin at the same time.
Below I present a list of tools and techniques I use to tackle database queries in web apps. Getting familiar with them can help you understand SQL on a much lower level than an ORM API.
Track down performance bottlenecks
I usually use pg-extras-rs and PgHero to track down query bottlenecks in my applications, together with hotpath-rs SQL performance profiling to trace slow queries from the application side.
PG Extras
pg-extras-rs is a Rust crate and CLI that provides insights into PostgreSQL internals. It offers the same features as the Heroku PG Extras plugin, for apps that are not using the default Heroku PostgreSQL plugin (implementations for other languages are also available). The step-by-step PG Extras performance guide explains how to use it to identify and fix PostgreSQL issues.
PgHero
You can hook up PgHero to your production application to gain powerful insights into your database queries performance. One downside is that it does not indicate from which places in your application code the queries originate.
A great feature is that it automatically warns you about slow queries. What’s more, it lets you run EXPLAIN and ANALYZE straight from the interface without having to access the database CLI.
One trick you could use here is to enable SQL statement logging in your app. With Rust and sqlx, executed queries are logged automatically when you enable debug level logs. Alternatively, you can make PostgreSQL itself log queries by tweaking the log_min_duration_statement setting.
You can later copy the resulting SQL logs (you need to change $1 etc. into argument values manually) to Pg Hero interface:
An advantage of automatic logs is that whenever your code runs a database query you can see its SQL without explicitly generating it.
EXPLAIN vs EXPLAIN ANALYZE
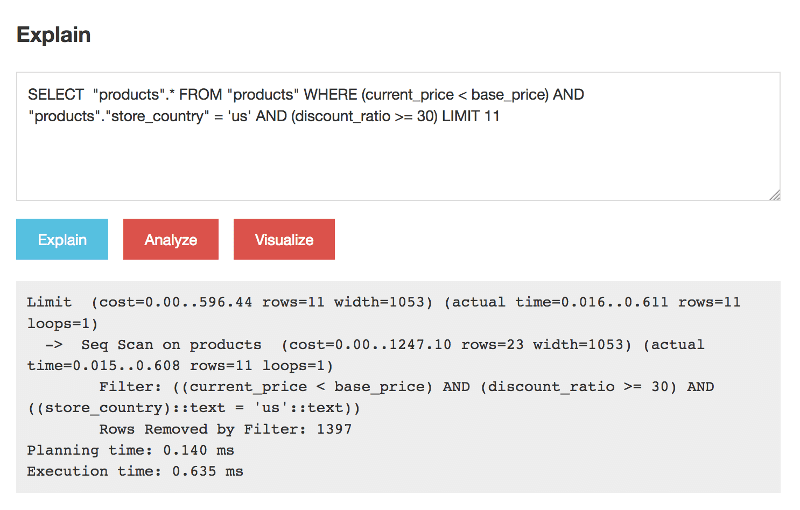
PostgreSQL has a built-in EXPLAIN command that shows the estimated cost of a query plan. ANALYZE is better because it performs the actual query and provides insight into real execution time, not hypothetical cost. To use it, prefix your query like this:
EXPLAIN (ANALYZE) SELECT * FROM users WHERE deleted_at IS NOT NULL;
ANALYZE actually runs the queryQuery visualizer
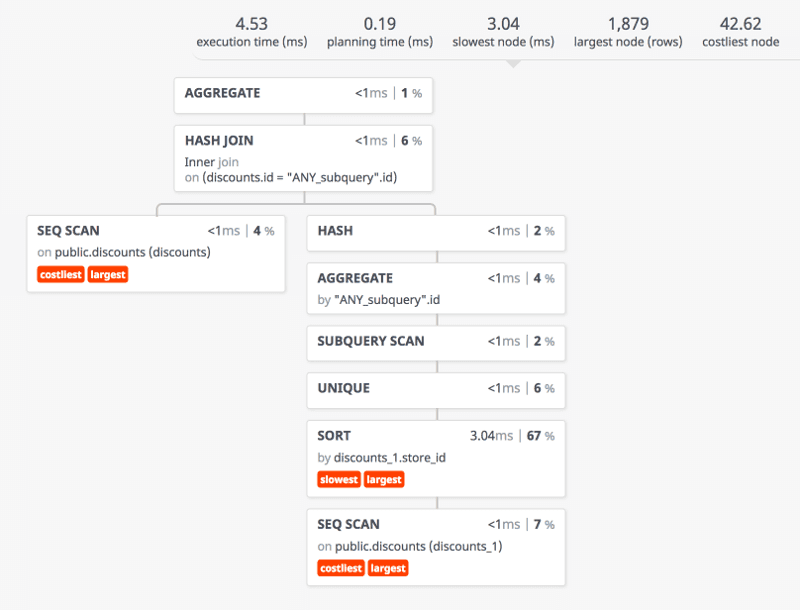
With PgHero you can even go all pro and visualize a query plan using a visualizer tool:
Explaining the EXPLAIN ANALYZE
One thing you need to watch out for in EXPLAIN ANALYZE reports are Seq Scans. Every such occurrence is potentially a big no-no because it means that Postgres needs to scan a table row by row to find matching entries. Such query will get slower with each new record added to the table and could be a serious problem in case of larger tables. You can fix it by adding an appropriate index.
What is “appropriate” might not be obvious at first because the way PostgreSQL handles indexes is quite complex. If you are not sure which index to add the best solution is to experiment with different settings and run EXPLAIN ANALYZE after each change to compare the actual query costs.
Remember that you cannot go all in for indexing every single attribute because every index slows down insert operations. You can also check out my other blog post for a more detailed introduction to using EXPLAIN ANALYZE in PostgreSQL.
Check database queries optimization results
Once you track down and optimize the queries you should check the actual results.
The best approach would be to perform benchmarks on a production database. The problem is that you probably don’t want to DDOS your production website. Also, remote benchmarks might not be reliable because of varying network conditions. In that case, the best solution could be to perform benchmarks on a local computer, with settings resembling a real production site.
Copy production database
You can copy your production database locally with pg_dump and pg_restore. How to do it exactly depends on your setup. If you use PostgreSQL on Heroku you should check out this article.
Seed local database to mimic production
It is highly possible that due to legal and privacy issues you will not be able to download and copy a real production data to work with it locally.
In that case you can seed your database to a size approximating a production using the generate_series SQL function:
INSERT INTO users (email, created_at)
SELECT 'user-' || i || '@example.com', now() - (i || ' minutes')::interval
FROM generate_series(1, 100000) AS i;
As long as your seeding queries are capable of generating unique data, all you need to do is to tweak the generate_series range to grow the dataset.
Use Siege for local benchmarks
Once you get your database setup ready you can start benchmarking. Remember to run your app compiled in a release mode (cargo build --release in Rust), because in debug builds many optimizations are disabled.
Siege is a great and simple to use benchmarking tool. It gives you a detailed report on how a specific endpoint performs:
Transactions:               32782 hits
Availability:              100.00 %
Elapsed time:               59.94 secs
Data transferred:         5186.03 MB
Response time:               0.01 secs
Transaction rate:          546.91 trans/sec
Throughput:                 86.52 MB/sec
Concurrency:                 19.97
Successful transactions:     32782
Failed transactions:             0
Longest transaction:          0.16
Shortest transaction:         0.00
Summary
Although database level optimization techniques have its limits they can take you a long way in improving the performance of your application. I hope that techniques I described will help you get more insight about your database queries.
If you want to continuously monitor SQL performance in a running Rust application - slow queries, N+1 problems, regressions - see the SQL tracing guide.