PostgreSQL EXPLAIN ANALYZE for Web Developers - Indexes
Published: April 13, 2021
Reading time: 12 minutes
hotpath-rs profiles CPU, memory, SQL, async execution, channels and lock contention.
 Explore hotpath-rs →
Interpreting the output of SQL EXPLAIN ANALYZE might seem like dark magic at first. In this blog post, I’ll be well… explaining it based on common use cases from web applications. Read on if you’ve ever wanted to start using EXPLAIN ANALYZE for debugging slow PostgreSQL queries but did not manage to wrap your head around it. We’ll discuss how the PostgreSQL query planner decides whether to use an index.

Examples in this tutorial use Rust with sqlx. However, the SQL query analysis tips apply to any web stack.
Initial setup for analyzing PostgreSQL index usage
unused_indexes is one of the more useful helper methods from the pg-extras-rs crate (see the PG Extras performance guide for implementations in other languages). If your production app has unused indexes, there’s an unnecessary overhead of updating them with each write operation. They also bloat the disk usage and increase the time for backup/restore operations.
It might not be obvious why your queries are not using an index. Let me guide you through the process of debugging it on the example of a soft-delete feature. We’ll distinguish objects that are currently soft-deleted by using an indexed datetime column discarded_at.
Let’s assume we’re working with the following table:
CREATE TABLE users (
  id bigserial PRIMARY KEY,
  email varchar NOT NULL,
  discarded_at timestamp,
  created_at timestamp NOT NULL
);

CREATE INDEX index_users_on_discarded_at ON users (discarded_at);
CREATE INDEX index_users_on_created_at ON users (created_at);
represented by this Rust struct, using the sqlx library:
#[derive(sqlx::FromRow)]
struct User {
    id: i64,
    email: String,
    // None = kept, Some = soft-deleted
    discarded_at: Option<NaiveDateTime>,
    created_at: NaiveDateTime,
}
Both datetime columns are indexed. We can fetch all kept users with WHERE discarded_at IS NULL and soft-deleted ones with WHERE discarded_at IS NOT NULL.
We’ll examine EXPLAIN query plans for sample queries using this table. To generate a query plan while running a query, prefix it with EXPLAIN (ANALYZE). Example:
SELECT * FROM users WHERE discarded_at IS NOT NULL;
Becomes:
EXPLAIN (ANALYZE) SELECT * FROM users WHERE discarded_at IS NOT NULL;
ANALYZE actually runs the queryI’m using PostgreSQL version 17, and the users table was seeded to ~100k objects. ~20% of objects were marked as soft-deleted. You might get different results from a similar setup. This post aims not to accurately explain when PostgreSQL uses indexes but rather to give you an insight into what variables can affect it and how to analyze this process.
How to check if SQL query will use an index?
Let’s now see what query plan is generated when we fetch all non-deleted objects:
EXPLAIN ANALYZE SELECT * FROM users WHERE discarded_at IS NULL;

Seq Scan on users  (cost=0.00..25727.02 rows=80142 width=128) (actual time=0.028..853.632 rows=80002 loops=1)
  Filter: (discarded_at IS NULL)
  Rows Removed by Filter: 20000
You can see that although there’s an index on the discarded_at column, the query planner instead decided to use a Seq Scan with Filter operation. It’s not a mistake, and your index is not broken. It means that in case a query is expected to return a high portion of an underlying table in no particular order, then using a sequential scan is usually faster. With index database first reads its metadata and then comes back to the table to get it.
There’s a handy trick to check if the index will be used if a planner is forced to do it. Execute those SQL commands in your database:
SET enable_seqscan TO off;
SHOW enable_seqscan;
/* off */
PgPool, acquire a single connection via pool.acquire() and run both the SET and the query on it.Changing this PostgreSQL setting discourages the use of Seq Scan operation if possible. It helps test your queries’ behavior on a smaller dataset where the query planner is unlikely to use indexes. A perfect use case is testing if the database will use a newly added index in the development environment before deploying it to production.
This setting is applied on a per-connection basis. However, connections are usually reused in a pool, so you should never use it in your production environment.
Let’s see the updated query plan:
EXPLAIN ANALYZE SELECT * FROM users WHERE discarded_at IS NULL;

Index Scan using index_users_on_discarded_at on users  (cost=0.42..35627.87 rows=80140 width=128) (actual time=0.030..952.091 rows=80002 loops=1)
  Index Cond: (discarded_at IS NULL)
You can now see the Index Scan node using index_users_on_discarded_at in Index Cond.
Let’s now revert the Seq Scan config:
SET enable_seqscan TO on;
And see how fetching the soft-deleted records will work:
EXPLAIN ANALYZE SELECT * FROM users WHERE discarded_at IS NOT NULL;

Index Scan using index_users_on_discarded_at on users  (cost=0.29..5480.79 rows=19857 width=128) (actual time=0.029..188.812 rows=20000 loops=1)
  Index Cond: (discarded_at IS NOT NULL)
You can see that since the query is expected to return only a subset of the table, the query planner defaults to using an index.
Ordering query results with indexes and in-memory
Another perfect use case for an index is sorting the results with an ORDER BY clause:
EXPLAIN ANALYZE SELECT * FROM users
WHERE discarded_at IS NOT NULL ORDER BY discarded_at ASC;

Index Scan using index_users_on_discarded_at on users  (cost=0.42..29251.20 rows=100102 width=129) (actual time=0.028..950.044 rows=100102 loops=1)
  Index Cond: (discarded_at IS NOT NULL)
Since indexes are ordered by default, an additional Sort operation is not needed.
If you request the results in a descending order, the same index can still be used:
EXPLAIN ANALYZE SELECT * FROM users
WHERE discarded_at IS NOT NULL ORDER BY discarded_at DESC;

Index Scan Backward using index_users_on_discarded_at on users  (cost=0.42..29251.20 rows=80102 width=129) (actual time=0.028..928.110 rows=80102 loops=1)
  Index Cond: (discarded_at IS NOT NULL)
Here we can see Index Scan Backward instead of Index Scan on index_users_on_discarded_at index.
Alternative to ordering results with index is an in-memory Sort operation. You can force query planner to use Seq Scan and Sort instead of Index Scan by disabling enable_indexscan and enable_bitmapscan PostgreSQL config variables. Disabling these variables on a copy of a production dataset can be useful to measure how much of a performance boost you get from indexes.
SET enable_indexscan TO off;
SET enable_bitmapscan TO off;
Let’s analyze our previous query with indexes disabled:
EXPLAIN ANALYZE SELECT * FROM users
WHERE discarded_at IS NOT NULL ORDER BY discarded_at ASC;

Sort  (cost=42398.84..42852.74 rows=181559 width=129) (actual time=433.045..613.256 rows=20000 loops=1)
  Sort Key: discarded_at
  Sort Method: quicksort  Memory: 6081kB
  ->  Seq Scan on users  (cost=0.00..26539.59 rows=181559 width=129) (actual time=0.367..240.388 rows=20000 loops=1)
        Filter: (discarded_at IS NOT NULL)
        Rows Removed by Filter: 80102
You can see a Sort Method quicksort Memory: 6081kB entry present.
Let’s go a bit deeper and tweak PostgreSQL internals. Lowering the amount of work_mem available will force a sort operation to take place on disk instead of a memory:
SET work_mem='64kB';
EXPLAIN ANALYZE SELECT * FROM users
WHERE discarded_at IS NOT NULL ORDER BY discarded_at ASC;

Sort  (cost=25975.28..25975.29 rows=1 width=129) (actual time=2021.479..2917.788 rows=20000 loops=1)
  Sort Key: discarded_at
  Sort Method: external merge  Disk: 4328kB
  ->  Seq Scan on users  (cost=0.00..25975.28 rows=1 width=129) (actual time=1.662..960.472 rows=20000 loops=1)
        Filter: (discarded_at IS NOT NULL)
        Rows Removed by Filter: 80102
We can now spot Sort Method: external merge Disk: 4328kB instead of in-memory operation. It’s an example on how tweaking different PG settings can influence query plans.
Just don’t do it on production!
Can PostgreSQL use multiple indexes for a single query?
I’ve been confused by this one for a long time. The common knowledge is that PostgreSQL planner can only use a single index per query. Let’s see it in action by querying for soft-deleted objects created over 90 days ago:
EXPLAIN ANALYZE SELECT * FROM users
WHERE discarded_at IS NOT NULL
AND created_at < now() - interval '90 days';

Bitmap Heap Scan on users  (cost=540.27..4206.15 rows=1107 width=128) (actual time=1.764..67.387 rows=7220 loops=1)
  Recheck Cond: ((created_at < '2021-01-10 15:45:36.598631'::timestamp without time zone) AND (discarded_at IS NOT NULL))
  Heap Blocks: exact=452
  ->  BitmapAnd  (cost=540.27..540.27 rows=1107 width=0) (actual time=1.687..1.694 rows=0 loops=1)
        ->  Bitmap Index Scan on index_users_on_created_at  (cost=0.00..170.24 rows=5577 width=0) (actual time=0.930..0.937 rows=14165 loops=1)
              Index Cond: (created_at < '2021-01-10 15:45:36.598631'::timestamp without time zone)
        ->  Bitmap Index Scan on index_users_on_discarded_at  (cost=0.00..369.22 rows=19857 width=0) (actual time=0.709..0.716 rows=20000 loops=1)
              Index Cond: (discarded_at IS NOT NULL)
You’ll probably agree with me that we’ve reached a stage where quickly grasping the output of a query plan is no longer possible. To simplify the analysis we’ll use a free visualizer tool.
It requires a JSON output format, so you have to prefix your query with:
EXPLAIN (ANALYZE, COSTS, VERBOSE, BUFFERS, FORMAT JSON)
It produces output like this:
[
  {
    "Plan": {
      "Node Type": "Index Scan",
      "Parallel Aware": false,
      "Scan Direction": "Forward",
      "Index Name": "index_users_on_discarded_at",
      "Relation Name": "users",
      "Schema": "public",
      ...
After pasting the JSON output into the visualizer, you should see a similar graph:
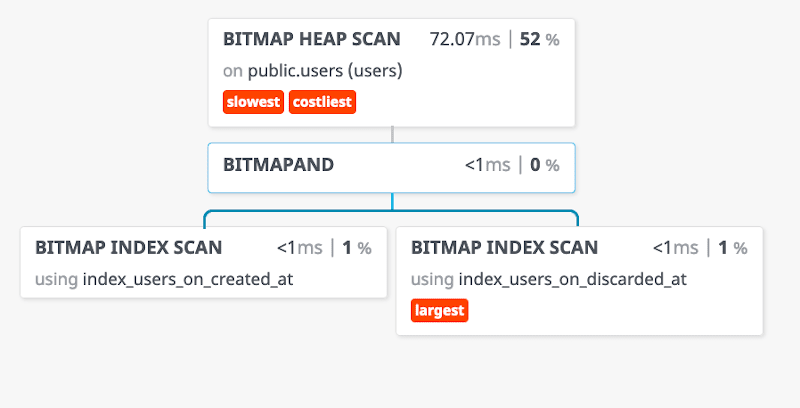
Now we can clearly see that both index_users_on_discarded_at and index_users_on_created_at are combined using the BITMAPAND operation. You can check out the PostgreSQL docs for more info on using multiple indexes.
Will PostgreSQL use my partial index?
Optimizing so-called “NULL” indexes can vastly reduce the amount of disk space used by your database. By “NULL” indexes, I mean ones that contain a high ratio of NULL values. In many cases, NULL is a legitimate value that conveys meaning, but often you’ll never search by it. In our case, the NULL discarded_at column means that the object has not been soft-deleted.
For the purpose of this tutorial, let’s assume that we want to remove NULL values from our index_users_on_discarded_at. It will reduce disk usage and overhead of updating it. We’ve also indexed the created_at column, so it is enough to make the queries for kept objects efficient:
EXPLAIN ANALYZE SELECT * FROM users
WHERE discarded_at IS NULL ORDER BY created_at DESC LIMIT 200;

Limit  (cost=0.42..79.85 rows=200 width=128) (actual time=0.235..6.524 rows=200 loops=1)
  ->  Index Scan Backward using index_users_on_created_at on users  (cost=0.42..31740.29 rows=79915 width=128) (actual time=0.218..2.558 rows=200 loops=1)
        Filter: (discarded_at IS NULL)
In this example Index Scan uses only the index_users_on_created_at index and discarding soft-deleted records using a Filter operation.
However, one use case prevents us from removing the index_users_on_discarded_at index entirely. Let’s assume that we periodically remove objects that were soft-deleted over a month ago:
EXPLAIN ANALYZE SELECT * FROM users
WHERE discarded_at IS NOT NULL
AND discarded_at < now() - interval '30 days';

Index Scan using index_users_on_discarded_at on users  (cost=0.29..4.30 rows=1 width=128) (actual time=0.018..0.028 rows=0 loops=1)
  Index Cond: (discarded_at < '2021-03-12 15:28:33.468457'::timestamp without time zone)
This query uses our index and would be inefficient without it.
Since only a small portion of our objects is soft-deleted, this index contains mostly NULL values. You can confirm that with the pg-extras-rs null_indexes method:
pgextras null_indexes

           index            | index_size | unique | indexed_column | null_frac | expected_saving
----------------------------+------------+--------+----------------+-----------+-----------------
index_users_on_discarded_at | 94400 kB   | f      | discarded_at   |   79.83%  | 75360 kB
Let’s convert this index to exclude NULL values and double-check if our query will still use it.
DROP INDEX CONCURRENTLY index_users_on_discarded_at;

CREATE INDEX CONCURRENTLY index_users_on_not_null_discarded_at
ON users (discarded_at) WHERE discarded_at IS NOT NULL;
CONCURRENTLY if you're adding or removing index on an existing production table. It prevents full table lock and potential downtime.Run those queries, and let’s check our query plan:
EXPLAIN ANALYZE SELECT * FROM users
WHERE discarded_at IS NOT NULL
AND discarded_at < now() - interval '30 days';

Index Scan using index_users_on_not_null_discarded_at on users  (cost=0.29..4.30 rows=1 width=128) (actual time=0.018..0.028 rows=0 loops=1)
  Index Cond: (discarded_at < '2021-03-12 15:28:33.468457'::timestamp without time zone)
enable_indexscan and enable_bitmapscan to force index scans if you're using a development database.Our new index_users_on_not_null_discarded_at is used, and we’re no longer indexing NULL values. Running null_indexes confirms that:
pgextras null_indexes

 index | index_size | unique | indexed_column | null_frac | expected_saving
-------+------------+--------+----------------+-----------+-----------------
(0 rows)
As you can see, EXPLAIN ANALYZE allows you to confidently make changes to your database based on solid evidence instead of a gut feeling.
Summary
Setting up correct indexes is one of the most effective ways to optimize your PostgreSQL database performance. EXPLAIN ANALYZE is insanely useful to help you understand how to do it correctly without blindly guessing what will happen if you add or remove yet another index.
EXPLAIN ANALYZE is invaluable when investigating a single slow query. If you want to continuously discover slow queries, N+1 problems, or regressions in a running Rust application, see the SQL tracing guide.
For a broader workflow covering discovery, benchmarking, and verification, read about tracking down slow PostgreSQL queries.
I hope that this post was a relatively lightweight introduction to using EXPLAIN ANALYZE for a deeper analysis of what’s going under the hood of your database engine.